
Incorporation of circulating tumor cells and whole-body metabolic tumor volume of 18F-FDG PET/CT improves prediction of outcome in IIIB stage small-cell lung cancer
Introduction
Distant metastases are the most common reason for the relapse of small-cell lung cancer (SCLC) (1). Circulating tumor cells (CTCs) are a subset of tumor cells with the ability to migrate from the primary site, intravasate into nearby blood and/or lymphatic vessels, and survive in the challenging microenvironment of the bloodstream. CTCs can also extravasate from the vascular system into the surrounding tissues and form micro metastases in secondary organs with the potential for growth into macroscopic tumors (2). In SCLC, the presence of ≥2 CTCs/7.5 mL of peripheral venous blood was found in 75% of patients with either limited disease or extensive disease (3). The number of CTCs has been demonstrated to be a predictor of prognosis (4). Moreover, the epithelial cell adhesion molecule (EpCAM)-based CTC detection system CELLSEARCH® has been shown to reliably detect CTCs at the lowest level in 7.5 mL of blood with the highest sensitivity and high repeatability (5).
18F-fluorodeoxyglucose (18F-FDG) positron emission tomography is currently the only molecular imaging agent that is widely used in the clinic. This modality takes advantage of glucose metabolism to capture an image of unperturbed tumor biology at diagnosis. 18F-FDG positron emission tomography/computed tomography (PET/CT) offers a multitude of semiquantitative metabolic parameters that are used to assess patient response to therapy and for prognostication in oncological patients (6). Whole-body metabolic tumor volume (WBMTV), which is defined as the volume of tumor tissue within the body with increased FDG uptake, is being increasingly investigated in FDG PET/CT (7-9), as it represents the extent of FDG uptake by tumor tissues beyond the intensity of FDG uptake.
However, the association of CTC and WBMTV with the prognosis of SCLC has not been established, and the ways that CTCs are associated with tumor glucose metabolism in SCLC are still unknown. To investigate this question, we report on the correlation of CTCs and the tumor FDG uptake parameter WBMTV with the value of the combination of CTCs and WBMTV in the prediction of the outcome of patients with stage IIIB SCLC.
Materials and methods
Study design
We retrospectively reviewed the history of patients with stage IIIB SCLC who were treated at Shandong Cancer Hospital and Institute from January 2012 to December 2014. The diagnosis of all patients was confirmed in accordance with the pathologic evidence. The clinical-pathological characteristics of age, sex, performance score (PS) ≤3, and chemotherapy regimen were collected for each patient by review of the medical records. The number of CTCs and the tumor FDG uptake parameter WBMTV were obtained from the blood and from PET/CT, respectively. The inclusion criteria were: 1) histological confirmation of stage IIIB SCLC; 2) >18 years of age; 3) PS≤3; and 4) ability to receive first-line chemotherapy. The exclusion criteria were as follows: 1) history of another type of cancer; 2) severe comorbidities or symptomatic heart disease; 3) a second primary cancer diagnosed within 5 years; or 4) allergy to PET-CT contrast agents.
This study was approved by the Institutional Review Board of the Shandong Cancer Hospital and Institute. Written informed consent was obtained from each patient before treatment.
Treatment plans
Routine staging included a history and physical examination, complete blood cell counts and chemistry panel, CT of the chest and upper abdomen, brain magnetic resonance imaging (MRI) and FDG PET/CT. All patients were treated with combined concurrent chemo radiotherapy. The chemotherapy regimen, which consisted of platinum (cisplatin or carboplatin) with either etoposide or irinotecan, was administered every 3 weeks for four cycles. Chest irradiation was initiated within one week after the second cycle of chemotherapy and consisted of 30 daily fractions of 1.8 or 2.0 Gy. All patients were treated with four cycles of this platinum-based regimen followed by prophylactic cranial irradiation, which consisted of 30 Gy in 15 fractions (10).
Patients were staged according to the new TNM classification (TNM 7th edition). Patients underwent CT after two and four cycles of chemotherapy to assess the tumor response, and thereafter, imaging was performed every 12 weeks for follow-up. Tumor size and response to therapy were independently re-evaluated according to the Response Evaluation Criteria in Solid Tumors (RECIST) version. 1.1 (11).
CTC enumeration
In all, 7.5 mL blood was drawn from patients with stage IIIB SCLC and stored in a 10 mL Cellsave (Veridex, Raritan) preservative tube before the initiation of chemotherapy, before cycle 2, and after cycle 4. Blood tubes were stored at room temperature and were centrally processed using the CELLSEARCH® system (Menarini Silicon Biosystems Inc., Huntington Valley, USA) 96 h after collection. This system consists of the CellPrep system, the CELLSEARCH Epithelial Cell Kit (for the measurement of CTCs), and the CellSpotter Analyzer. To determine the number of CTCs, 7.5 mL of blood was mixed with 6 mL of buffer, centrifuged at 800× g for 10 min, and then processed using CellTracks® Autoprep. The CELLSEARCH® Epithelial Cell Kit was used for CTC enrichment and staining. Image acquisition and CTC enumeration were performed in the Celltracks™ Analyzer II (12). CTCs were counted by two independent investigators, who were blinded to the clinical information.
Image acquisitions
FDG PET/CT scans were performed before treatment initiation to evaluate the patients. PET/CT studies were performed using combined PET/CT scanners (Discovery LS System, GE Medical Systems, Milwaukee, WI, USA). CT scans imaged the skull base to the upper thigh using parameters with a peak voltage of 120 Kv, an automated tube current of 10 to 130 mA, a rotation time of 0.7 s, a scan length of 40−50 s and a slice thickness of 3 mm. The maximum standardized uptake value (SUVmax) in each region of interest was determined using the whole-body attenuation corrected image and a formula: the tissue concentration of 18F-FDG was measured by PET/the injected dose/body weight. SUVmax is an established measurement of maximal tumor metabolic activity that facilitates the identification of tumor metastases (13). Furthermore, WBMTV was determined by the attenuation-corrected PET data using the volume viewer software on an Advantage Workstation 4.5 (GE Medical Systems, Milwaukee, WI, USA). First, a rectangular parallelepiped-shaped volume of interest fully encasing all involved lesions in the axial, coronal and sagittal FDG PET/CT images was drawn. Then, the boundaries of voxels with an SUV intensity that exceeded 3.0 were automatically produced (9). Second, normal organs including the brain, heart, stomach, liver, intestines, kidney, ureter, bladder and brown adipose tissue were manually subtracted from the product of the previous step. Third, false-positive lesions, such as inflammation, infection or other benign FDG-avid lesions based on histopathological reports or other imaging modalities were subtracted. Finally, the MTV of the whole-body tumor burden produced by the previous steps was recorded in each patient.
Grouping
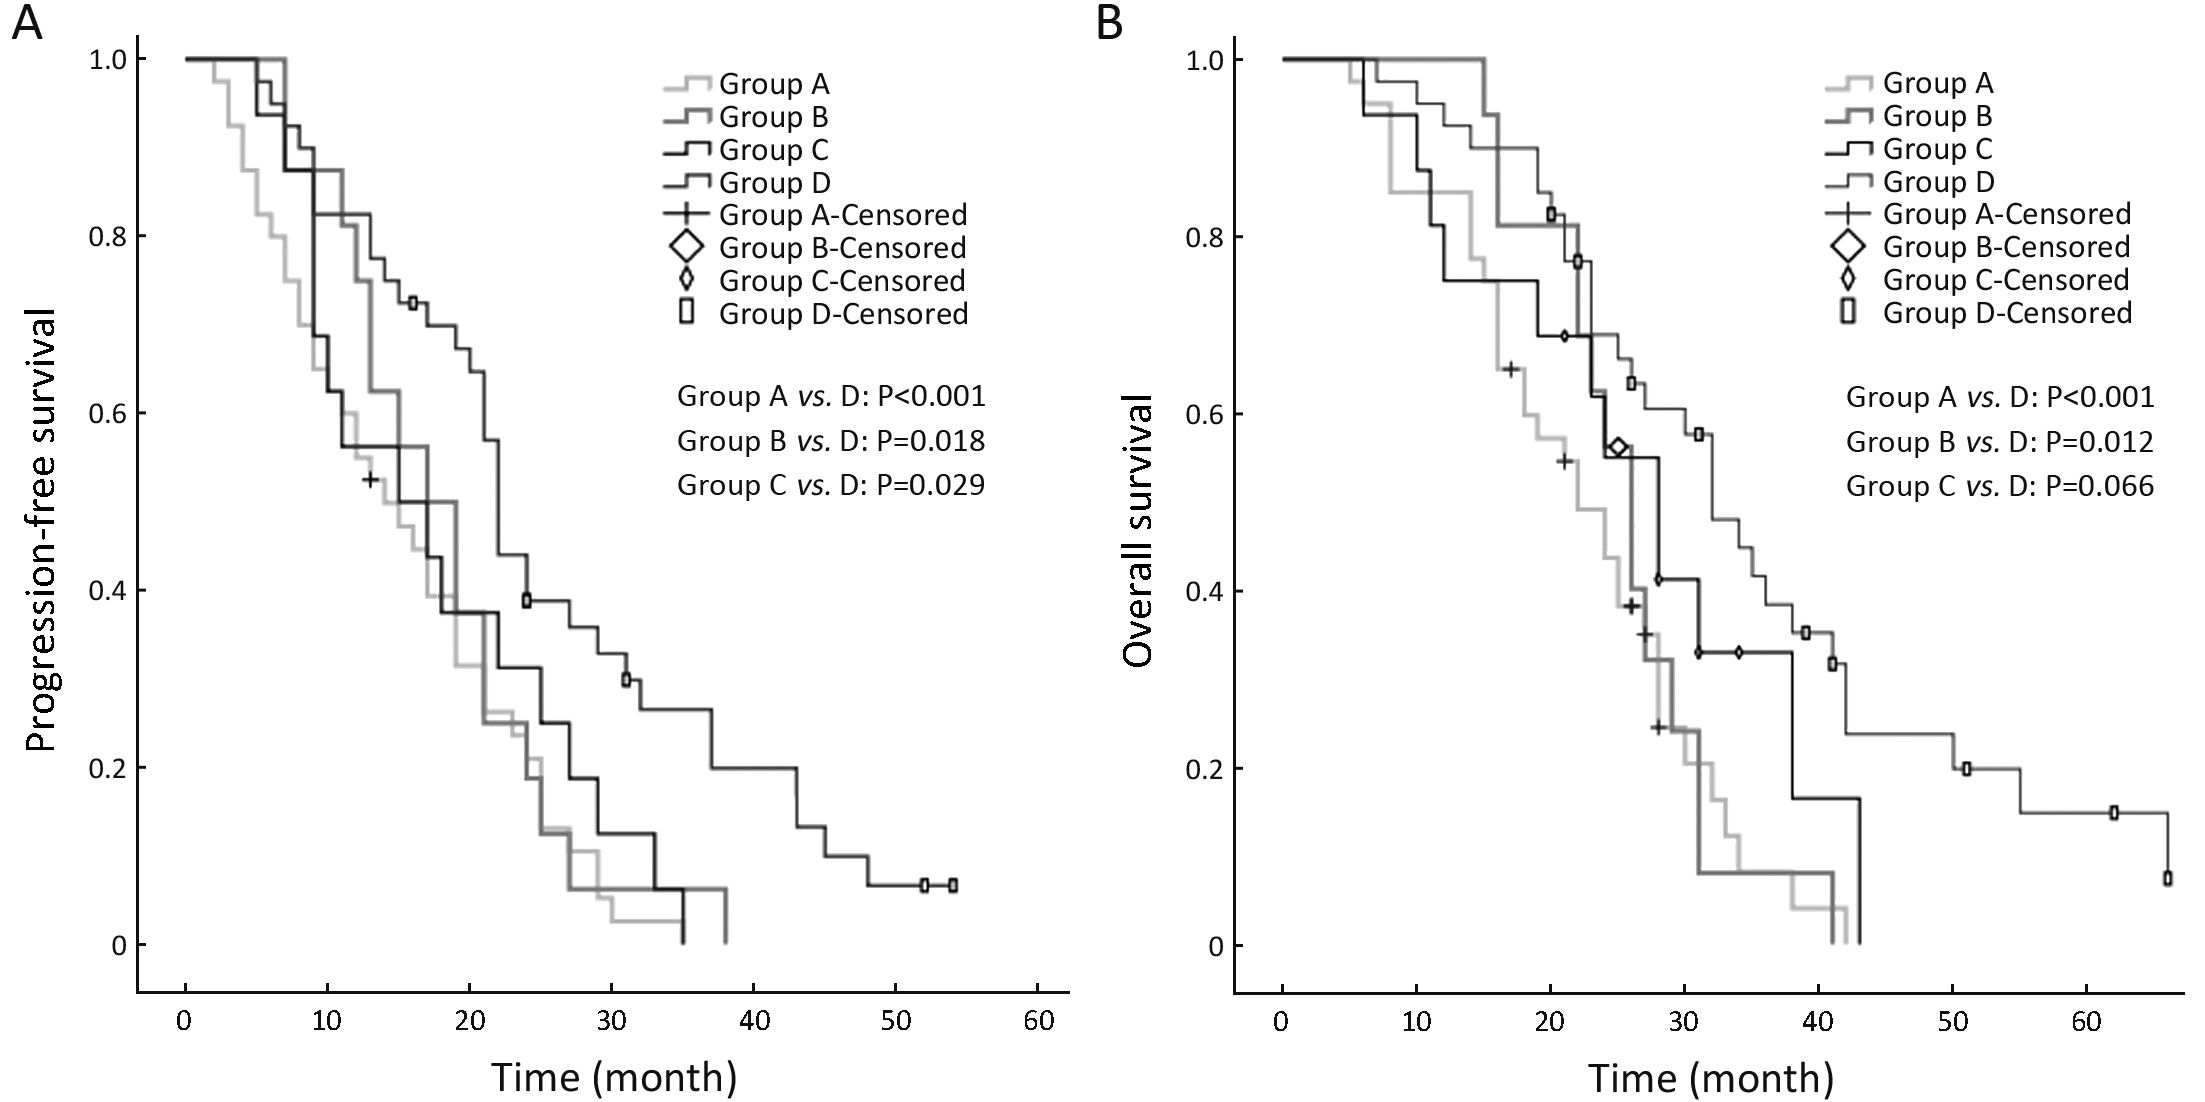
The entire cohort was classified into four subgroups according to the median number of CTCs at baseline and the median WBMTV before the initiation of treatment. Out of 112 patients, 40 (36%) who were classified as Group A had a CTC count >19.5 and a WBMTV>266.5 cm3. Eighteen (16%) patients classified as Group B had a CTC count >19.5 and a WBMTV≤266.5 cm3, and 16 (14%) were classified as Group C and had a CTC count ≤19.5 and a WBMTV>266.5 cm3. Finally, 38 (34%) were classified as Group D and had a CTC count ≤19.5 and a WBMTV≤266.5 cm3.
Statistical analysis
Descriptive statistics for clinical, imaging and CTC variables were presented as medians and interquartile ranges (IQRs) or as numbers with percentages, as appropriate. Correlations between tumor response and CTC counts at different time points were tested with non-parametric Spearman’s rho bivariate correlation with a two-tailed test for significance. A paired t-test was used to compare the number of CTCs at the any two of the three time points. The Spearman rank test was used to determine the correlation between CTC counts and WBMTV, as it accounted for the non-parametric distribution of the underlying variables. Log-rank tests were used for the univariate analysis. Variables that showed significant associations in the univariate analysis (P<0.05) were included in a multivariate stepwise backward Cox regression model to validate their independent prognostic value. Independent variables including sex, age, Eastern Cooperative Oncology Group (ECOG) PS, disease stage, CTC count, and WBMTV were analyzed. PFS was defined as the period from the start of chemotherapy until tumor progression or death due to progression. OS was measured from the start of the first chemotherapy cycle until death. If it was impossible to obtain the complete survival time of a patient or if the disease did not progress, the patient status was assumed at the last known survival and/or contact date. OS and PFS curves were produced using the Kaplan-Meier method, and survival differences between groups were assessed by the log-rank test.
Statistical analyses were performed using SPSS 18.0 software for Windows (SPSS Inc., Chicago, IL, USA). P<0.05 was considered statistically significant.
Results
Patient characteristics
One hundred and twenty-nine patients were consecutively enrolled in this study. One hundred and twelve patients completed the treatment mentioned above and were ultimately eligible for survival analyses. The median age for the cohort was 59 (range, 49−69) years, and of the patients, 67 (60%) were male and 45 (40%) were female. The numbers of patients with ECOG PSs of 0 to 1 (considered good) and 2 to 3 were 79 (71%) and 33 (29%), respectively. Moreover, 76 (68%) patients received cisplatin+etoposide chemotherapy, whereas 36 (32%) patients received cisplatin alone. At the time of analysis, 89 (79%) patients had died and 23 (21%) patients were still alive (Table 1). The TNM classification was IIIB in 112 patients.
Full table
CTC test characteristics
Out of 112 patients, 87 (78%) had a baseline count of two or more CTCs in 7.5 mL of blood (4) before the initiation of therapy (IQR, 16−341), 17 (15%) had 0 CTCs and 8 (7%) patients had 1 CTC in 7.5 mL of blood. The median number of CTCs was 19.5 in 7.5 mL of blood (IQR, 2−247.5).
After the first cycle of chemotherapy, in 90 (80%) out of 112 patients, the number of CTCs decreased either dramatically or slightly. The CTC counts in 16 patients with 0 CTCs and 3 patients with 1 CTC remain the same. In 3 patients, the number of CTCs increased from 4 to 9, from 13 to 45, and from 0 to 2, respectively. The median number of CTCs in 112 patients was 19.5 in 7.5 mL of blood (IQR, 9.5−34) after the first cycle of chemotherapy.
Compared with CTCs in patients before the initiation of chemotherapy, in 94 (84%) out of 112 patients, the number of CTCs decreased after four cycles of chemotherapy. The CTC counts in 17 patients with 0 CTCs remained the same. In 1 patient, the number of CTCs increased from 4 to 127.
Compared with CTCs in patients after the first cycle of chemotherapy, in 10 (9%) out of 112 patients, the number of CTCs increased after four cycles of chemotherapy.
After four cycles of chemotherapy, 13 (12%) out of 112 patients had >19.5 CTCs. At the three time points, the difference in the number of CTCs was significant (P<0.001).
FDG PET-CT uptake characteristics
The median WBMTV before the initiation of treatment was 266.5 (range, 73−403.5) cm3.
Correlation analysis
The number of CTCs in 7.5 mL of blood at baseline, the number of CTCs after the first cycle of chemotherapy, and the number of CTCs after four cycles of chemotherapy as well as the WBMTV before the initiation of treatment were not correlated with disease stage (P=0.128, P=0.235, P=0.889 and P=0.174, respectively). The number of CTCs at baseline did not correlate with the WBMTV before the initiation of treatment (P=0.241).
Survival analysis
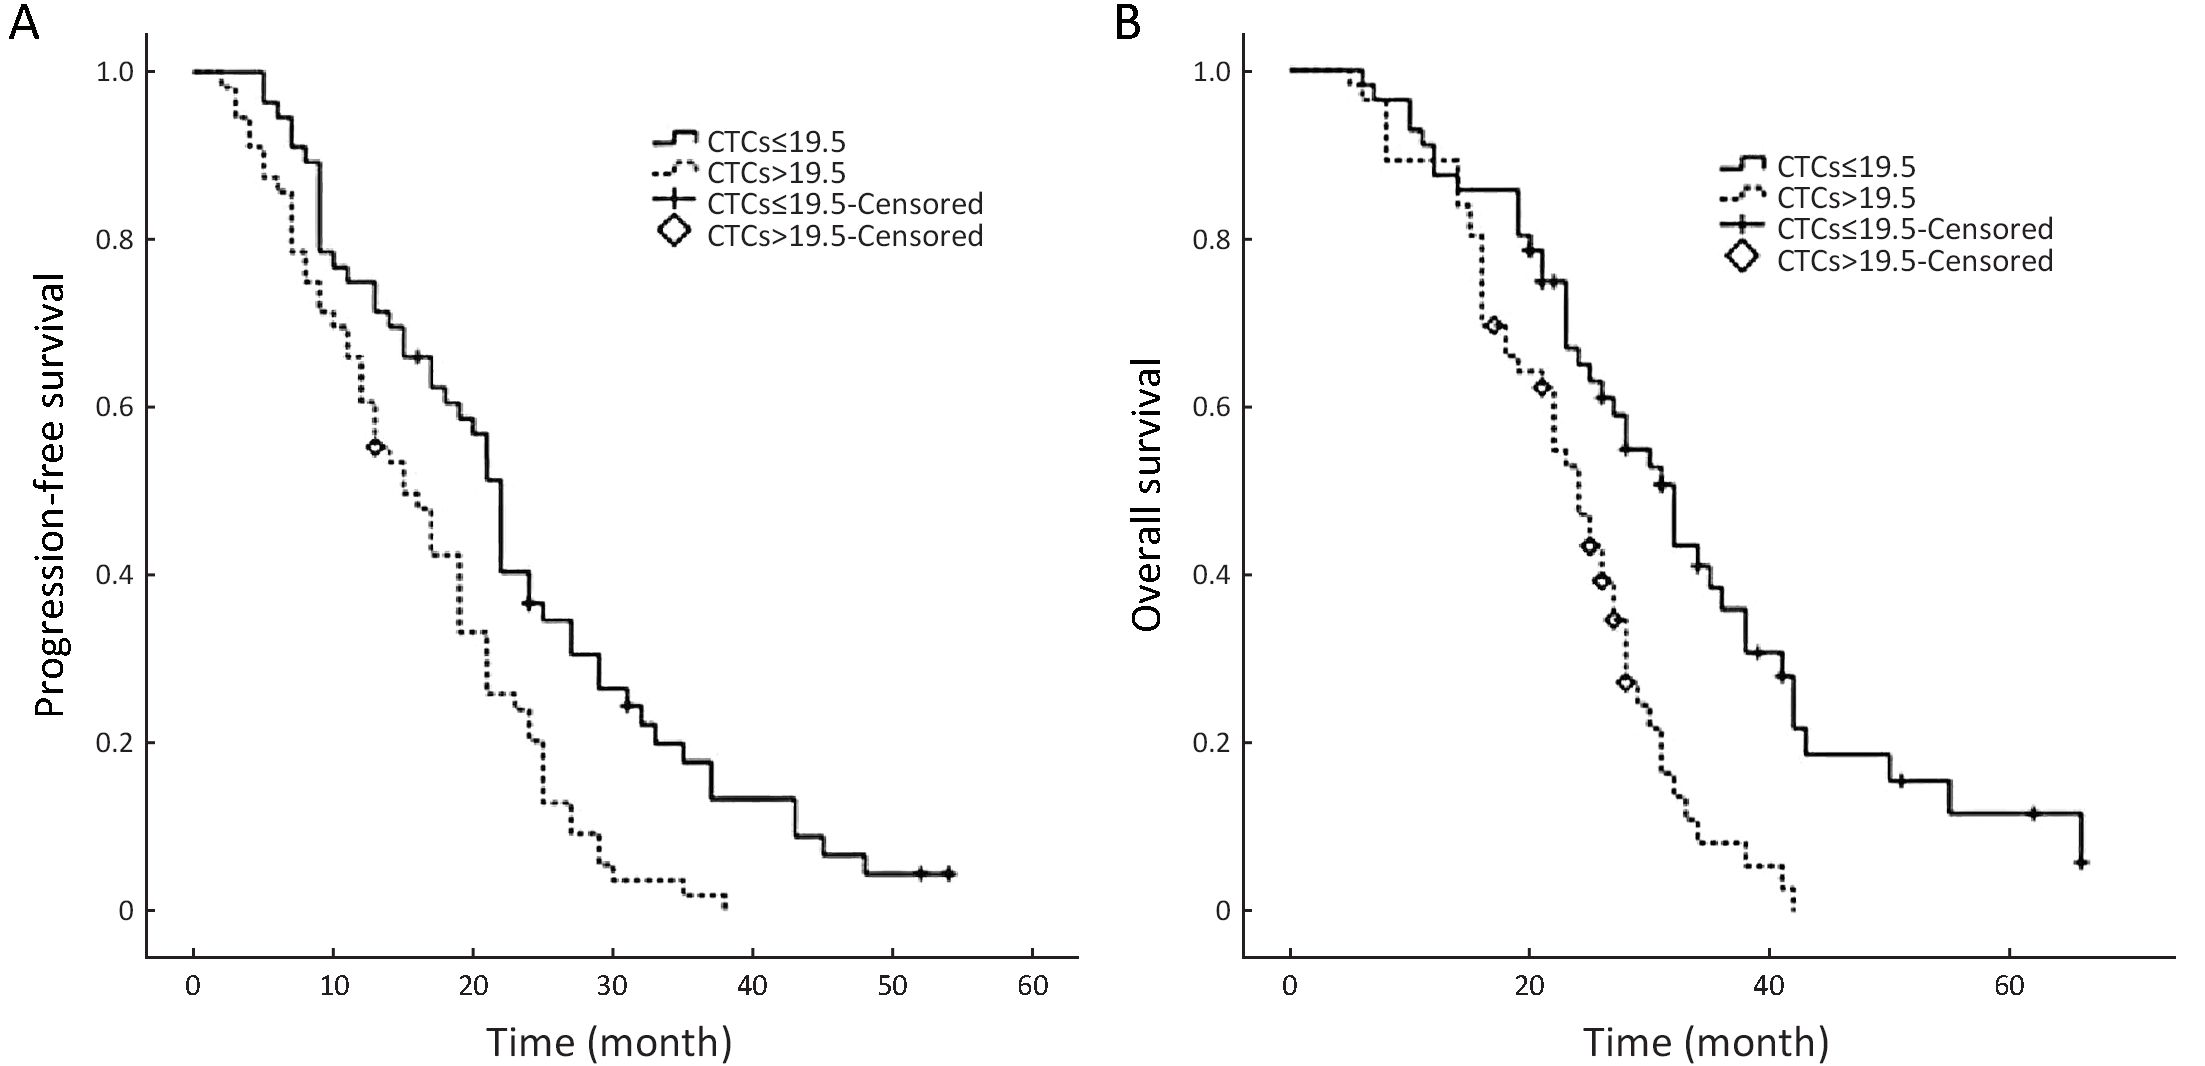
The median PFS and OS times of patients with CTC counts ≤19.5 in 7.5 mL of blood were 21 months (IQR, 12−29 months) and 28 months (IQR, 20−36 months), respectively. The median PFS and OS times of patients with CTC counts >19.5 in 7.5 mL of blood were 15 months (IQR, 9−21 months) and 23 months (IQR, 16−27 months), respectively. The differences in PFS and OS were both statistically significant (P=0.001, P<0.001 for PFS and OS, respectively) (Figure 1).
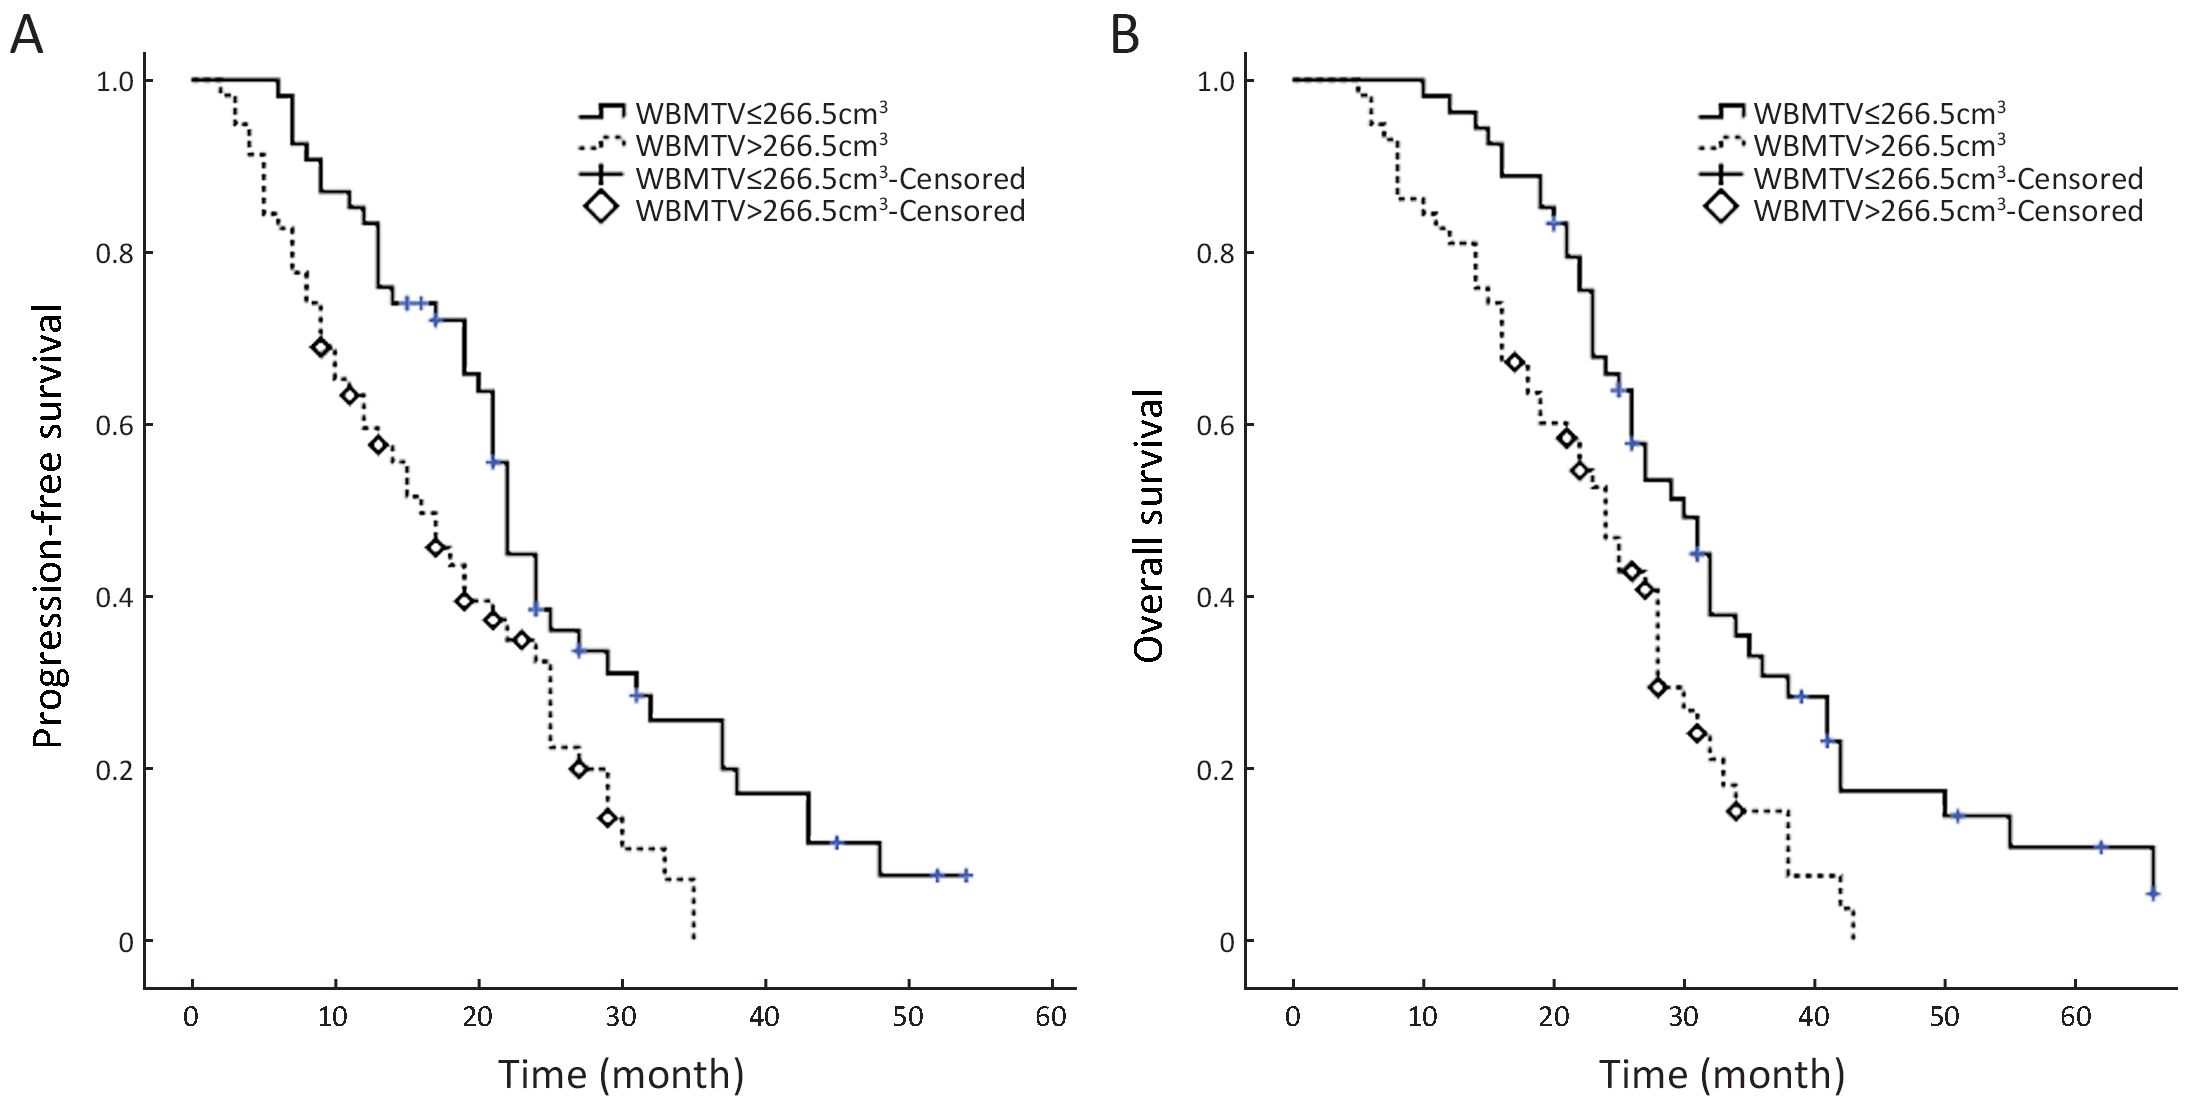
The median PFS and OS times of patients with a WBMTV ≤266.5 cm3 were 21 months (IQR, 14−27 months) and 30 months (IQR, 25−38 months), respectively. The median PFS and OS times of patients with a WBMTV >266.5 cm3 were 13 months (IQR, 8−23 months) and 22 months (IQR, 15−28 months), respectively. The differences in both PFS and OS were statistically significant (P<0.001, P=0.002 for PFS and OS, respectively) (Figure 2). The subgroup differences in the median PFS were statistically significant (Group A vs. D, P<0.001; Group B vs. D, P=0.018; Group C vs. D, P=0.029) as were those in the median OS (Group A vs. D, P<0.001; Group B vs. D, P=0.012) (Figure 3).
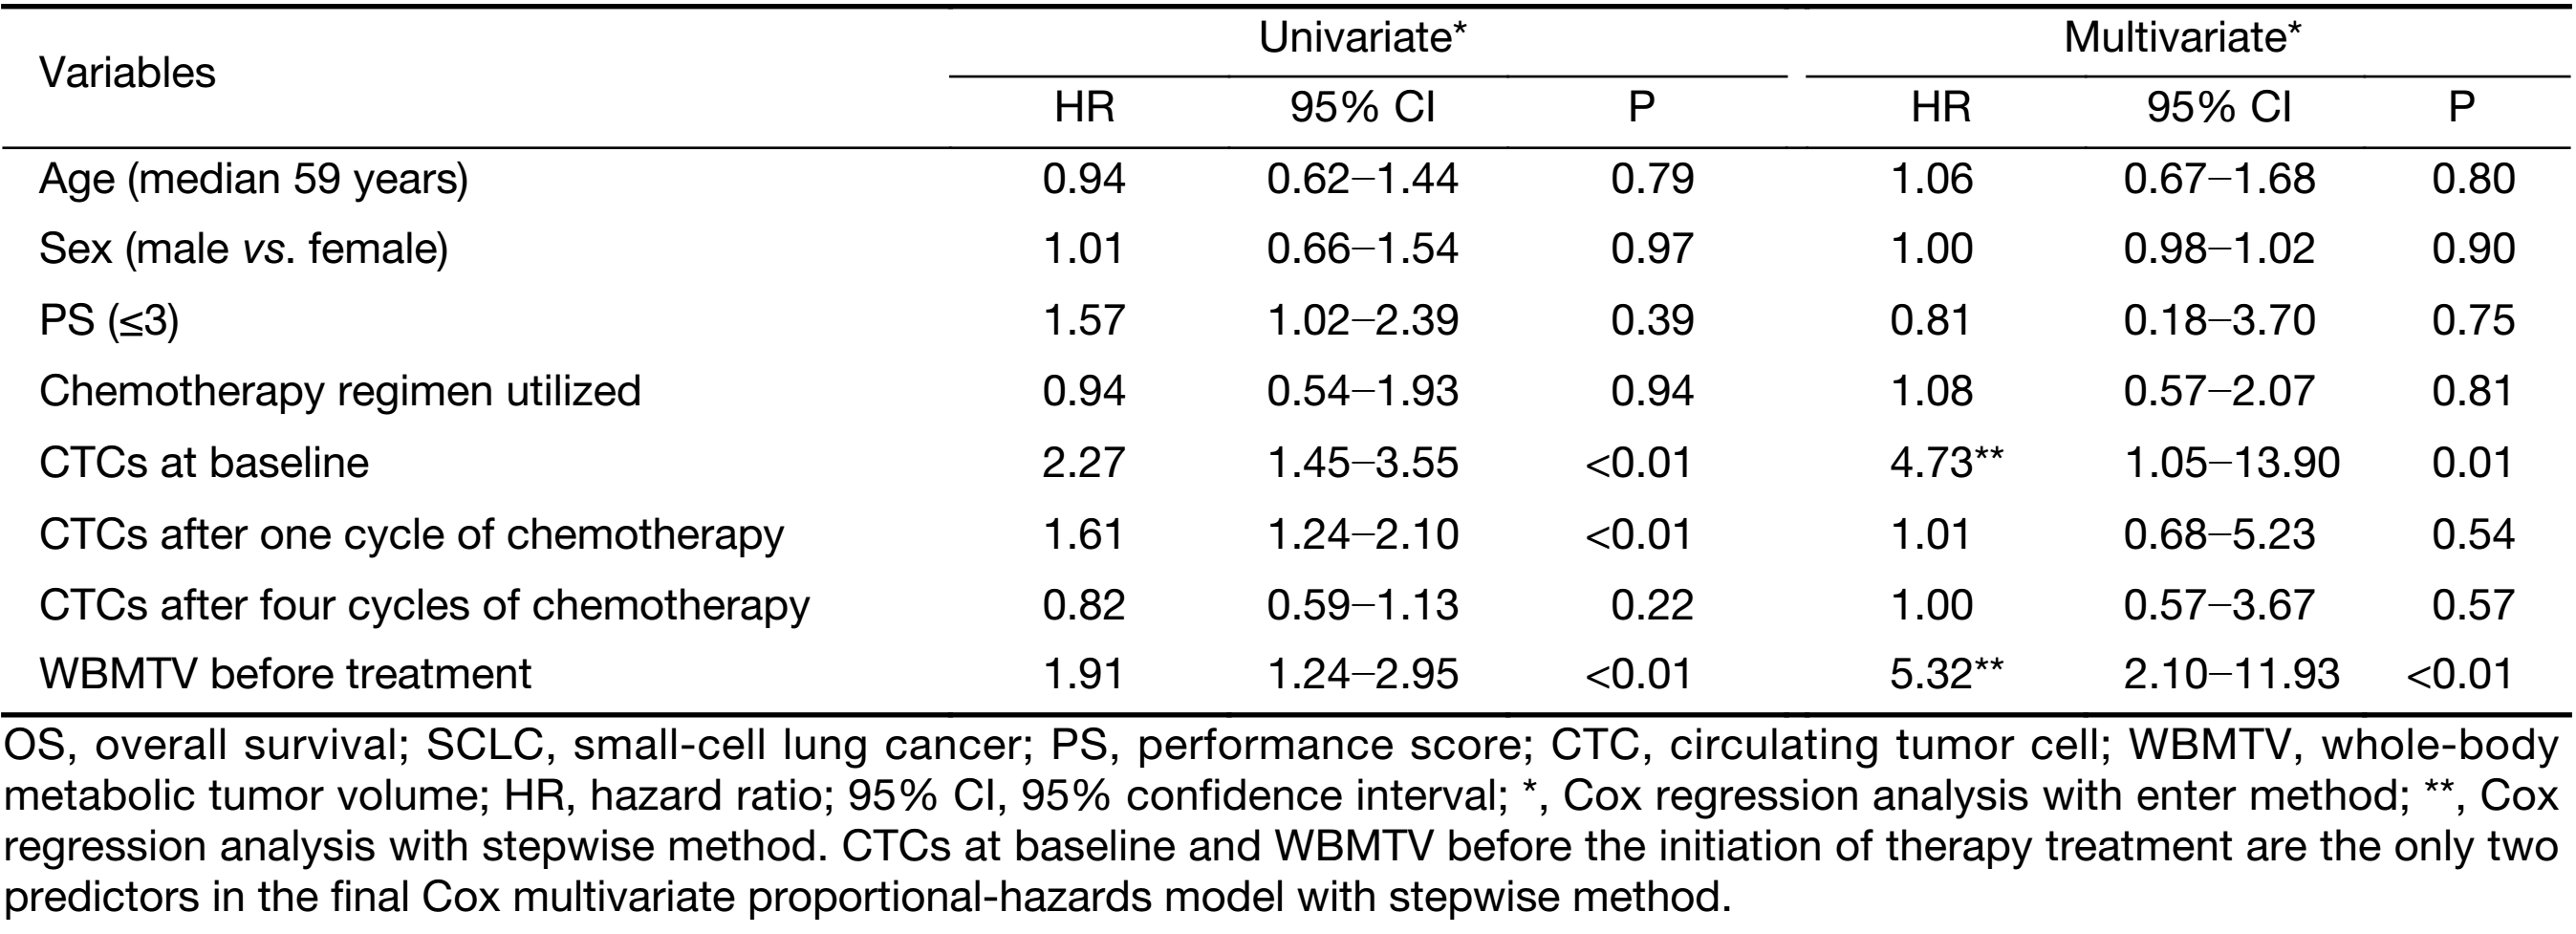
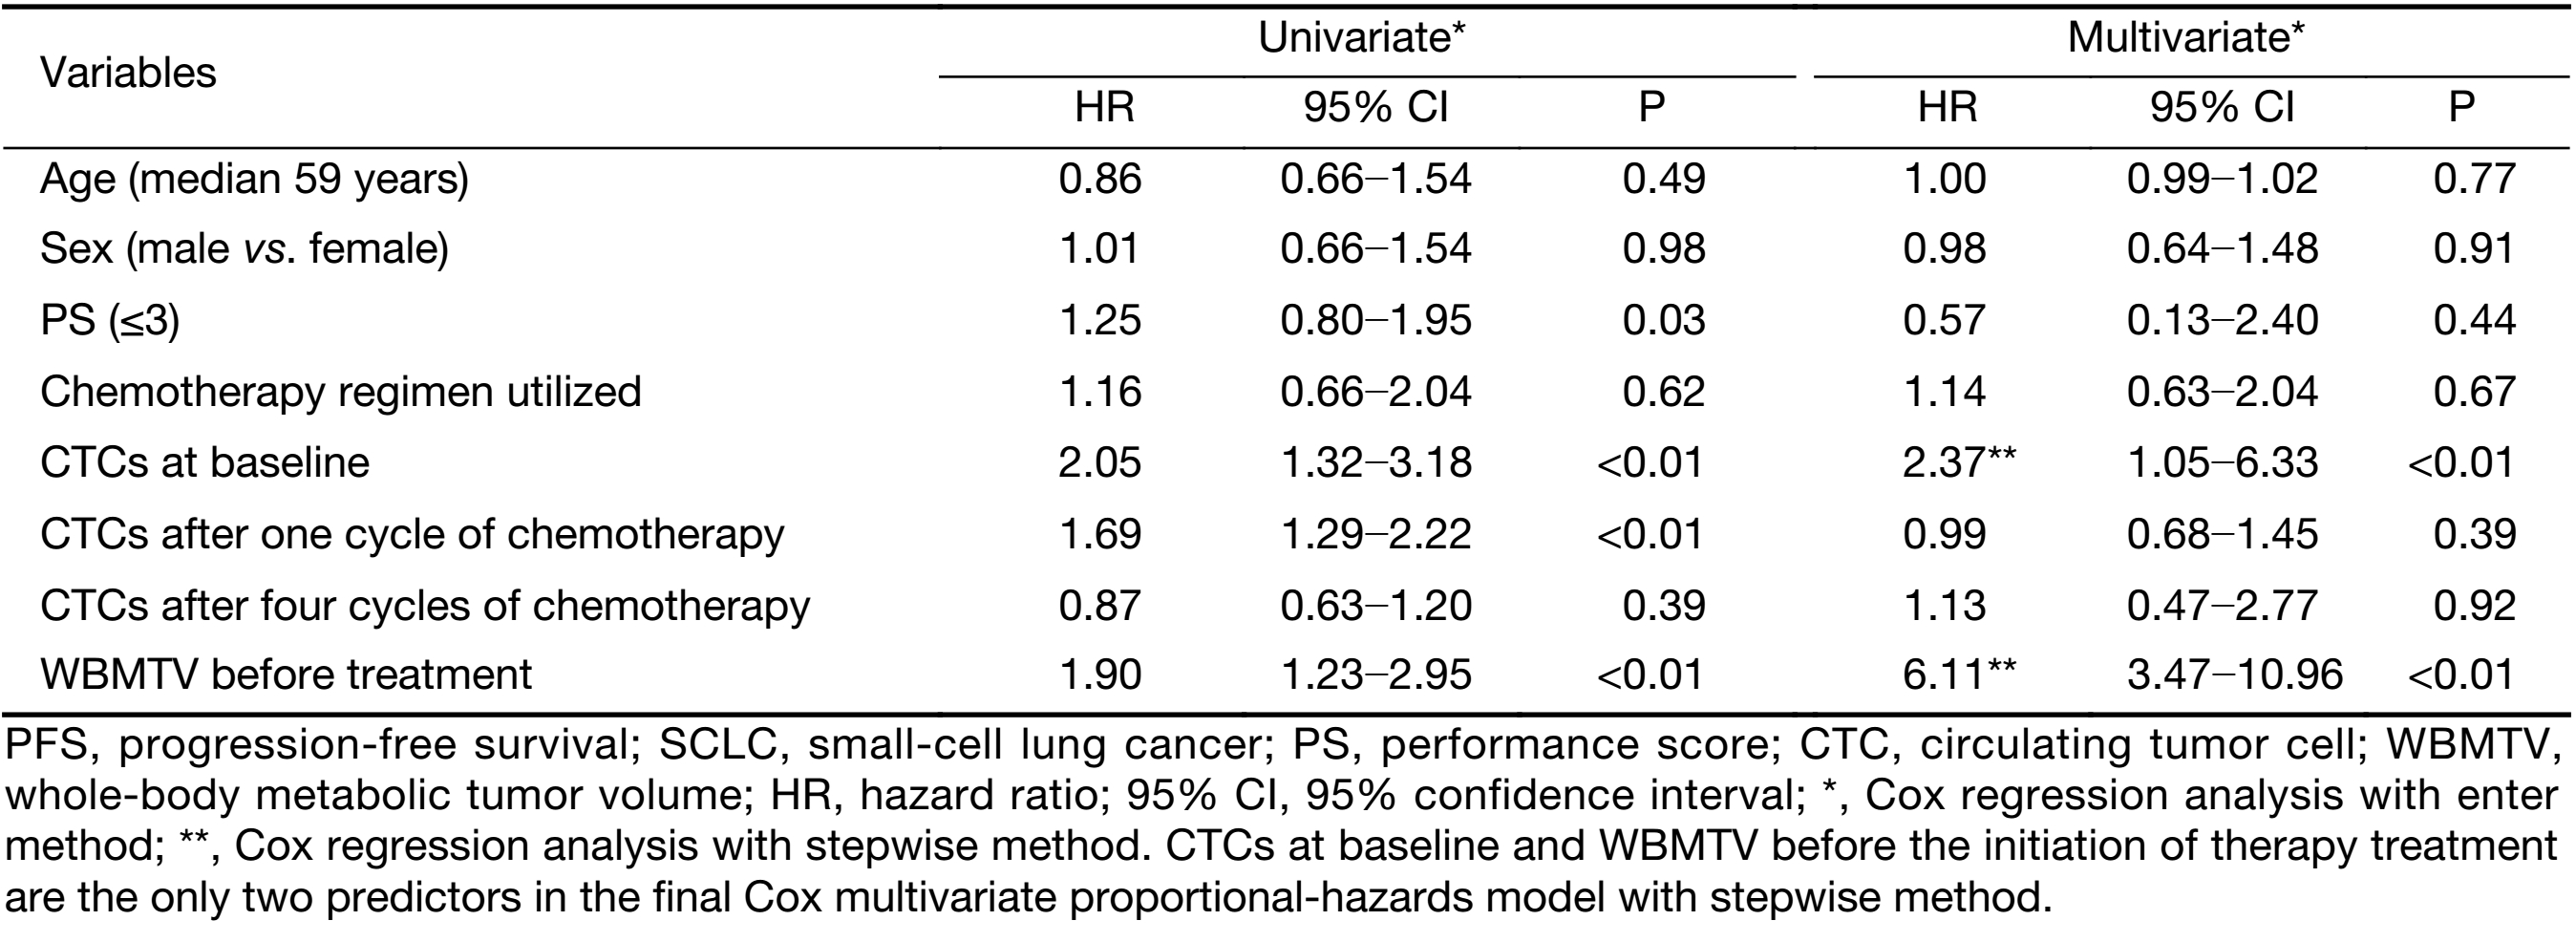
In the univariate analyses, the number of CTCs at baseline, the number of CTCs after one cycle of chemotherapy and the WBMTV before the initiation of treatment were significant relevant factors for both PFS and OS; however, sex, age, PS, disease stage and the number of CTCs after four cycles of chemotherapy were not significant factors (Table 2, 3).
Full table
Full table
In the multivariate Cox proportional hazards regression analysis, the number of CTCs at baseline and the WBMTV before the initiation of treatment were still relevant factors for PFS and OS. When the disease stage was considered, the number of CTCs after one cycle of chemotherapy, the number of CTCs after four cycles of chemotherapy, and the decrease in CTCs after four cycles compared with baseline, sex, age and PS were also significant factors (Table 2, 3).
Discussion
In our study, two or more CTCs were detected in 7.5 mL of blood before the initiation of therapy in 81 (72%) patients with stage IIIB SCLC. This finding is similar to the results presented in previous studies on advanced SCLC (3,4,14), which suggested that CTCs were highly prevalent in SCLC. The numbers of CTCs largely differed before the initiation of therapy. The highest number of CTCs, which was 13,786, was detected in a patient with stage IIIB disease and decreased to 79 after four chemotherapy cycles and concurrent radiotherapy. Additionally, the OS of the patients was only 8 months. A previous study indicated that the TNM staging system for SCLC had shown some variation in survival point estimates. This led to a rather poor discrimination in 5-year survival, which ranged from 38% for Ct1N0M0 to 1% for M1b disease (15). This implied that we should introduce indexes other than the TNM system for a more precise prognostic prediction.
For CTC enumeration, we used the CELLSEARCH® system, which has been extensively validated in patients with metastatic carcinomas (16-18). From 7.5 mL of blood, this system enriches cells that express the EpCAM antigen and identifies CTCs as nucleated cells that express cytokeratin 8/18 or 19 and that lack the leukocyte antigen CD45 (19). The expression of EpCAM has been detected in 100% of primary SCLC tumor cells using immunohistochemistry (20), but only 44% of metastatic bone marrow samples were found to express EpCAM (14). Furthermore, EpCAM+ cells in SCLC patients would decrease the efficacy of chemotherapy (21), which may bias the correlation between the number of CTCs and the prognosis. The reason was that CTCs were detected based on EpCAM positivity, while CTCs that did not express EpCAM were ignored, even though EpCAM-negative cells are associated with relative sensitivity to chemotherapy. One report showed that the EpCAM-based microcavity array (MCA) system had the potential to isolate significantly more CTCs and CTC clusters in advanced lung cancer patients compared with the CELLSEARCH® system (22). Among others, all the findings mentioned above would affect the results of the CTC counts in this study.
In this study, the absolute numbers of CTCs at baseline and the WBMTV before the initiation of treatment were independent relevant factors for survival according to the multivariate Cox analysis, even when disease stage was taken into account. In the multicenter study initiated by Hiltermann et al. (4), the absolute number of CTCs after one cycle of chemotherapy in patients with SCLC was the strongest predictor of survival. However, their result differed from the result of our study. We ascribe the difference to the disease stage of the patients. Only patients with stage IIIB disease were enrolled in our study rather than patients with stages II, III and IV, who were included in other investigations. The purpose of this was to reveal the advantage of the incorporation of the CTC count and the WBMTV for the prediction of prognosis to control for the interference of disease stage. That may be the reason that neither the CTC number nor the WBMTV was correlated with disease stage. This was similar to the result of a study that reported that the WBMTV was not correlated with disease stage and that both the number of CTCs and the WBMTV were independent relevant factors for death and progression (9). Whether the CTC number was correlated with disease stage had not been addressed in previous studies on SCLC.
In the multivariate Cox regression analyses, despite the method used, the absolute number of CTCs after the first cycle and after four cycles of chemotherapy was not a predictor of survival. This may reflect the phenomenon that the phenotype of SCLC often changes into a more complex, secondary chemo-resistant phenotype (19,23). These changes are reflected in the biomarkers expressed on the surface of CTCs, which might also influence the accuracy of CTC detection. Furthermore, this might bias the correlation between the enumeration of CTCs and the prognosis of patients.
WBMTV represents the systemic tumor burden in the entire body and encompasses the primary tumor, regional lymph nodes and all distant metastases (7). The incorporation of the WBMTV with either conventional staging or TNM staging can provide more detailed prognostic information than disease staging alone (9). The disease stage could be considered the combination of metastatic potential (CTC) (24) and overall tumor burden (WBMTV) for the whole body (25). The data discussed above suggest that the incorporation of CTC count and the WBMTV could predict outcomes more precisely than disease stage alone. The patients with stage IIIB disease were classified into four subgroups according to the median number of CTCs and the median WBMTV. The differences in survival among the four subgroups were clearly significant. The result showed that patients with stage IIIB disease with different CTC counts and WBMTV characteristics exhibit a different survival. A similar study was initiated in non-small cell lung cancer (NSCLC) and demonstrated the feasibility and efficacy of the incorporation of CTC count and the WBMTV in the prediction of patient outcomes and in the treatment guidance.
This study is the first to reveal the correlation between CTCs and WBMTV in SCLC. The number of CTCs at baseline did not correlate with WBMTV before the initiation of treatment. This result differs from the results presented in a previous study in NSCLC conducted by Nair et al. (26), even with the weak correlation between CTCs and WBMTV. The difference may stem from the different biological and histopathological features between SCLC and NSCLC, as SCLC has a greater propensity for hematogenous metastases at an early stage, as well as the different disease stage (IIIB vs. I−IV).
Conclusions
This study proposes that CTC count and WBMTV are correlated with tumor progression and death in patients with SCLC, and also reveals that the number of CTCs at baseline did not correlate with WBMTV before the initiation of treatment. Next, we plan to confirm these conclusions in more patients with other disease stages.
Acknowledgements
This study was supported by a grant from the National Health and Family Planning Commission of China (No. 201402011).
Footnote
Conflicts of Interest: The authors have no conflicts of interest to declare.
References
- Le Péchoux C, Dunant A, Senan S, et al. Standard-dose versus higher-dose prophylactic cranial irradiation (PCI) in patients with limited-stage small-cell lung cancer in complete remission after chemotherapy and thoracic radiotherapy (PCI 99-01, EORTC 22003-08004, RTOG 0212 and IFCT 99-01): a randomised clinical trial. Lancet Oncology 2009;10:467–74. DOI:10.1016/S1470-2045(09)70101-9
- Syrigos K, Fiste O, Charpidou A, et al. Circulating tumor cells count as a predictor of survival in lung cancer. Crit Rev Oncol Hematol 2018;125:60–8. [PubMed] DOI:10.1016/j.critrevonc.2018.03.004
- Naito T, Tanaka F, Ono A, et al. Prognostic impact of circulating tumor cells in patients with small cell lung cancer. J Thorac Oncol 2012;7:512–9. [PubMed] DOI:10.1097/JTO.0b013e31823f125d
- Hiltermann TJ, Pore MM, van den Berg A, et al. Circulating tumor cells in small-cell lung cancer: a predictive and prognostic factor. Ann Oncol 2012;23:2937–42. [PubMed] DOI:10.1093/annonc/mds138
- Andreopoulou E, Yang LY, Rangel KM, et al. Comparison of assay methods for detection of circulating tumor cells in metastatic breast cancer: AdnaGen AdnaTest BreastCancer Select/DetectTM versus Veridex CellSearchTM system . Int J Cancer 2012;130:1590–7. [PubMed] DOI:10.1002/ijc.26111
- Sharma A, Mohan A, Bhalla AS, et al. Role of various semiquantitative parameters of 18F-FDG PET/CT studies for interim treatment response evaluation in non-small-cell lung cancer . Nucl Med Commun 2017;38:858–67. [PubMed] DOI:10.1097/MNM.0000000000000723
- Liao S, Lan X, Cao G, et al. Prognostic predictive value of total lesion glycolysis from 18F-FDG PET/CT in post-surgical patients with epithelial ovarian cancer . Clin Nucl Med 2013;38:715–20. [PubMed] DOI:10.1097/RLU.0b013e31829f57fa
- Kim CY, Hong CM, Kim DH, et al. Prognostic value of whole-body metabolic tumour volume and total lesion glycolysis measured on 18F-FDG PET/CT in patients with extranodal NK/T-cell lymphoma . Eur J Nucl Med Mol Imaging 2013;40:1321–9. [PubMed] DOI:10.1007/s00259-013-2443-6
- Oh JR, Seo JH, Chong A, et al. Whole-body metabolic tumour volume of 18F-FDG PET/CT improves the prediction of prognosis in small cell lung cancer . Eur J Nucl Med Mol Imaging 2012;39:925–35. [PubMed] DOI:10.1007/s00259-011-2059-7
- Tai P, Assouline A, Joseph K, et al. Prophylactic cranial irradiation for patients with limited-stage small-cell lung cancer with response to chemoradiation. Clin Lung Cancer 2013;14:40–4. [PubMed] DOI:10.1016/j.cllc.2012.04.005
- Watanabe H, Okada M, Kaji Y, et al. New response evaluation criteria in solid tumours-revised RECIST guideline (version 1.1). Gan To Kagaku Ryoho 2009;36:2495–501. [PubMed]
- Danila DC, Heller G, Gignac GA, et al. Circulating tumor cell number and prognosis in progressive castration-resistant prostate cancer. Clin Can Res 2007;13:7053–8. DOI:10.1158/1078-0432.CCR-07-1506
- Dashevsky BZ, Zhang C, Yan L, et al. Whole body metabolic tumor volume is a prognostic marker in patients with newly diagnosed stage 3B non-small cell lung cancer, confirmed with external validation. Eur J Hybrid Imaging 2017;1:8. [PubMed] DOI:10.1186/s41824-017-0013-z
- Bevilacqua S, Gallo M, Franco R, et al. A " live” biopsy in a small-cell lung cancer patient by detection of circulating tumor cells. Lung Cancer 2009;65:123–5. [PubMed] DOI:10.1016/j.lungcan.2009.01.019
- Shepherd FA, Crowley J, Van Houtte P, et al. The International Association for the Study of Lung Cancer lung cancer staging project: proposals regarding the clinical staging of small cell lung cancer in the forthcoming (seventh) edition of the tumor, node, metastasis classification for lung cancer. J Thorac Oncol 2007;2:1067–77. [PubMed] DOI:10.1097/JTO.0b013e31815bdc0d
- Kaifi JT, Kunkel M, Zhu J, et al. Circulating tumor cells are associated with diffuse spread in stage IV colorectal cancer patients. Cancer Biol Ther 2013;14:1174–81. [PubMed] DOI:10.4161/cbt.26884
- Fischer JC, Niederacher D, Topp SA, et al. Diagnostic leukapheresis enables reliable detection of circulating tumor cells of nonmetastatic cancer patients. Proc Natl Acad Sci U S A 2013;110:16580–5. [PubMed] DOI:10.1073/pnas.1313594110
- Pierga JY, Bidard FC, Cropet C, et al. Circulating tumor cells and brain metastasis outcome in patients with HER2-positive breast cancer: the LANDSCAPE trial. Ann Oncol 2013;24:2999–3004. [PubMed] DOI:10.1093/annonc/mdt348
- Hou JM, Greystoke A, Lancashire L, et al. Evaluation of circulating tumor cells and serological cell death biomarkers in small cell lung cancer patients undergoing chemotherapy. Am J Path 2009;175:808–16. [PubMed] DOI:10.2353/ajpath.2009.090078
- Brezicka T. Expression of epithelial-cell adhesion molecule (Ep-CAM) in small cell lung cancer as defined by monoclonal antibodies 17-1A and BerEP4. Acta Oncol 2005;44:723–7. [PubMed] DOI:10.1080/02841860500218561
- Kularatne BY, Lorigan P, Browne S, et al. Monitoring tumour cells in the peripheral blood of small cell lung cancer patients. Cytometry 2002;50:160–7. [PubMed] DOI:10.1002/cyto.10071
- Hosokawa M, Kenmotsu H, Koh Y, et al. Size-based isolation of circulating tumor cells in lung cancer patients using a microcavity array system. PLoS One 2013;8:e67466. DOI:10.1371/journal.pone.0067466
- Brambilla E, Moro D, Gazzeri S, et al. Cytotoxic chemotherapy induces cell differentiation in small-cell lung carcinoma. J Clin Oncol 1991;9:50–61. [PubMed] DOI:10.1200/JCO.1991.9.1.50
- Hoshimoto S, Shingai T, Morton DL, et al. Association between circulating tumor cells and prognosis in patients with stage III melanoma with sentinel lymph node metastasis in a phase III international multicenter trial. J Clin Oncol 2012;30:3819–26. [PubMed] DOI:10.1200/JCO.2011.40.0887
- Kim CY, Hong CM, Kim DH, et al. Prognostic value of whole-body metabolic tumour volume and total lesion glycolysis measured on 18F-FDG PET/CT in patients with extranodal NK/T-cell lymphoma . Eur J Nucl Med Mol Imaging 2013;40:1321–9. [PubMed] DOI:10.1007/s00259-013-2443-6
- Nair VS, Keu KV, Luttgen MS, et al. An observational study of circulating tumor cells and 18F-FDG PET uptake in patients with treatment-naive non-small cell lung cancer . PLoS One 2013;8:e67733. [PubMed] DOI:10.1371/journal.pone.0067733