

Aneuploidy of chromosome 8 in circulating tumor cells correlates with prognosis in patients with advanced gastric cancer
Introduction
Circulating tumor cells (CTCs) are shed from primary or metastatic solid tumors into the circulation (1). Several studies suggest that measuring CTCs serves as a "liquid biopsy", enabling non-invasive and frequent monitoring of therapeutic responses in cancer patients in real time (1-6). A study performed on 52 advanced gastric cancer (AGC) patients in Japan confirmed that patients with unfavorable CTC counts 2 or 4 weeks after initiation of chemotherapy had shorter median progression-free survival (PFS) and overall survival (OS) compared with those with favorable CTC counts (7). Similar results were also obtained in our previous work with 136 AGC patients, indicating that quantification of CTCs may be a promising approach for evaluating chemotherapeutic efficacy and predicting prognosis of AGC patients. Also, a persistently favorable CTC count or an early conversion to a favorable CTC count after therapy may indicate improved prognosis. In contrast, patients with persistently unfavorable CTCs or who converted to an unfavorable CTC count after therapy fared significantly worse, suggesting a limited treatment response. Longitudinal changes of CTCs in response to therapy may help in rapidly indicating acquired resistance in individual patients before they are radiographically evaluated (8).
In addition to counting CTCs, pinpointing specific targeted-therapy-or chemotherapy-resistant CTC subtype classified by tumor biomarker expression and/or chromosome ploidy may be a better approach (3,9-11). Our previous study indicated that aneuploidy of chromosome 8 in CTCs of AGC patients correlated with chemotherapeutic efficacy of paclitaxel (PTX) and cisplatin (DDP) (12). The number of pre-treatment triploid CTCs in patients was inversely correlated with chemotherapeutic efficacy. After administration of PTX or DDP, triploid CTCs had intrinsic resistance to chemotherapeutic reagents, whereas multiploid CTCs (≥4 copies on chromosome 8) developing acquired resistance. Similar observations were made in a DDP-treated gastric neuroendocrine cancer patient-derived xenograft (PDX) model (13). Identification of diverse CTC subtypes with distinct clinical significance could help guide more precise personal therapy and allow more robust analyses (14).
In this study, we extended previous studies to investigate whether and how distinct CTC subtypes with diverse ploidy of chromosome 8 correlate with patients' clinical prognosis in terms of PFS and OS. Subtraction enrichment (SE) integrated with immunostaining-fluorescence in situ hybridization (iFISH) was applied to enrich and characterize aneuploidy of chromosome 8 in CTCs (12). Correlations of quantified multiploid CTCs in patients under therapy with clinical prognosis were investigated to evaluate the utility of comparing multiploid CTCs for monitoring therapeutic response in AGC patients.
Materials and methods
Patients and sample collection
Thirty-one newly diagnosed AGC patients (>18 years) were enrolled in the study at Peking University Cancer Hospital from October 2013 to August 2014. Locally advanced, recurrent, metastatic gastric or gastroesophageal junction adenocarcinoma was histopathologically diagnosed and confirmed. Patients who had not received treatment and those who had a Karnofsky performance status >60, with adequate organ function and evaluable tumor lesions were eligible for this study. All enrolled patients were given first-line PTX or DDP-based chemotherapy (15). Those histopathologically diagnosed as human epidermal growth factor receptor 2 (HER2)-positive cancer received anti-HER2 targeted therapy and DDP chemotherapy (16).
Six weeks (2 cycles) after therapy, evaluation of clinical response was performed using computed tomography (CT) according to Response Evaluation Criteria in Solid Tumors (RECIST) version 1.1 criteria (17). Responses were categorized as partial response (PR, at least a 30% decrease in the sum of diameters of target lesions), progressive disease (PD, at least a 20% increase in the sum of diameters of target lesions), or stable disease (SD, neither sufficient shrinkage to qualify as PR nor a sufficient increase to qualify as PD). Written informed consent was obtained from all subjects. The study was approved by the Ethics Committee of Peking University Cancer Hospital and was performed according to the Declaration of Helsinki principles.
Enrichment and characterization of CTCs by SE-iFISH
Peripheral blood samples were collected from patients before and 6 weeks (the first evaluation of efficacy) after therapy initiation. CTCs were enriched using SE-iFISH (Cytelligen, San Diego, CA, USA) according to a previously published protocol (12). Briefly, 7.5 mL of patient blood was collected into a tube containing acid-citrate-dextrose (ACD) anticoagulant (Becton Dickinson, Franklin Lakes, NJ, USA), followed by thoroughly mixing and overlaying on 3 mL of hCTC separation matrix. The solution was centrifuged at 450× g for 5 min at room temperature. Supernatants above red blood cells were collected and incubated with immunomagnetic particles conjugated to anti-leukocytes monoclonal antibodies at room temperature for 10 min with gentle shaking. Samples were then subjected to magnetic separation to remove leukocytes. The magnetic particle-free solution was spun down at 500× g for 2 min at room temperature. Sedimented cells were thoroughly mixed with cell fixative and applied onto Cytelligen-coated CTC slides. Samples were subsequently subjected to immunostaining with a cocktail of Alexa Fluor 594-conjugated monoclonal anti-CD45 and Alexa Fluor 488-conjugated anti-pan-cytokeratin (PanCK) (CK4, 5, 6, 8, 10, 13 and 18) for 1 h in the dark, followed by FISH with Centromere Probe (CEP) 8 Spectrum-Orange (Vysis, Abbott Laboratories, Abbott Park, IL, USA) using a S500 StatSpin ThermoBrite Slide Hybridization/Denaturation System (Abbott Molecular, Des Plaines, IL, USA). CTCs were identified as 4',6-diamidino-2-phenylindole (DAPI)+/CD45–/PanCK+ or– with aneuploid chromosome 8.
Statistical analysis
Statistical analyses were performed with IBM SPSS Statistics (Version 21.0; IBM Corp., New York, USA). Correlation of CTC positivity with clinicopathologic characteristics and clinical responses was examined using Fisher's exact test. The threshold of CTCs was established with nonparametric receiver operating characteristic (ROC) analysis, and optimal threshold values were determined to maximize the Youden index (sensitivity+specificity-1), which was determined by selecting a point that maximizes the number of subjects correctly classified, and giving equal weight to sensitivity and specificity (18). PFS was defined as the duration from initial blood collection to the time that clinical progression was confirmed or the participants were censored. OS was defined as the time from initial blood collection to the date that death occurred or the participants were censored. Kaplan-Meier survival plots for PFS or OS were generated based on numbers of total or aneuploid CTCs before and after therapy, and survival curves were compared using log-rank tests. Cox proportional hazards regression was applied to determine the univariate and multivariate hazard ratios (HR) for PFS and OS. Pre- and post-therapy total CTC counts, subtypes of multiploid chromosome 8 CTCs, and standard clinical factors including gender, age, liver and peritoneal metastases, Lauren classification, HER2 status and the type of treatment were subjected to univariate analyses for PFS and OS. Significant parameters in the univariate analysis were then included in the multivariate analysis. P<0.05 was considered statistically significant, and all P values were two-sided.
Results
Correlation of CTCs in pre-treatment patients with clinicopathological characteristics
Quantification of total and aneuploid CTCs (≥4 copies on chromosome 8) in pre-treatment patients by SE-iFISH was performed on all of the 31 enrolled AGC patients. The median number of CTCs detected in whole population of patients was 3 (range, 0−720) and the mean number (x±s) was 32±128. And ≥1 CTCs per 7.5 ml were detected in 93.5% of patients before treatment. Examination of correlation between CTC numbers and various clinico-pathological characteristics is summarized in Table 1. All patients with mixed type carcinoma were positive for CTCs (≥2 per 7.5 mL), whereas patients with intestinal and diffuse type cancer had a CTC positivity of 83.3% and 33.3%, respectively. Further pairwise comparison revealed that positivity of CTC in intestinal and mixed type patients was significantly higher than that of diffuse type (P=0.038, P=0.021, respectively). No obvious correlation was found in other clinicopathological characteristics, including gender, age, primary tumor sites, metastatic sites, and HER2 status.
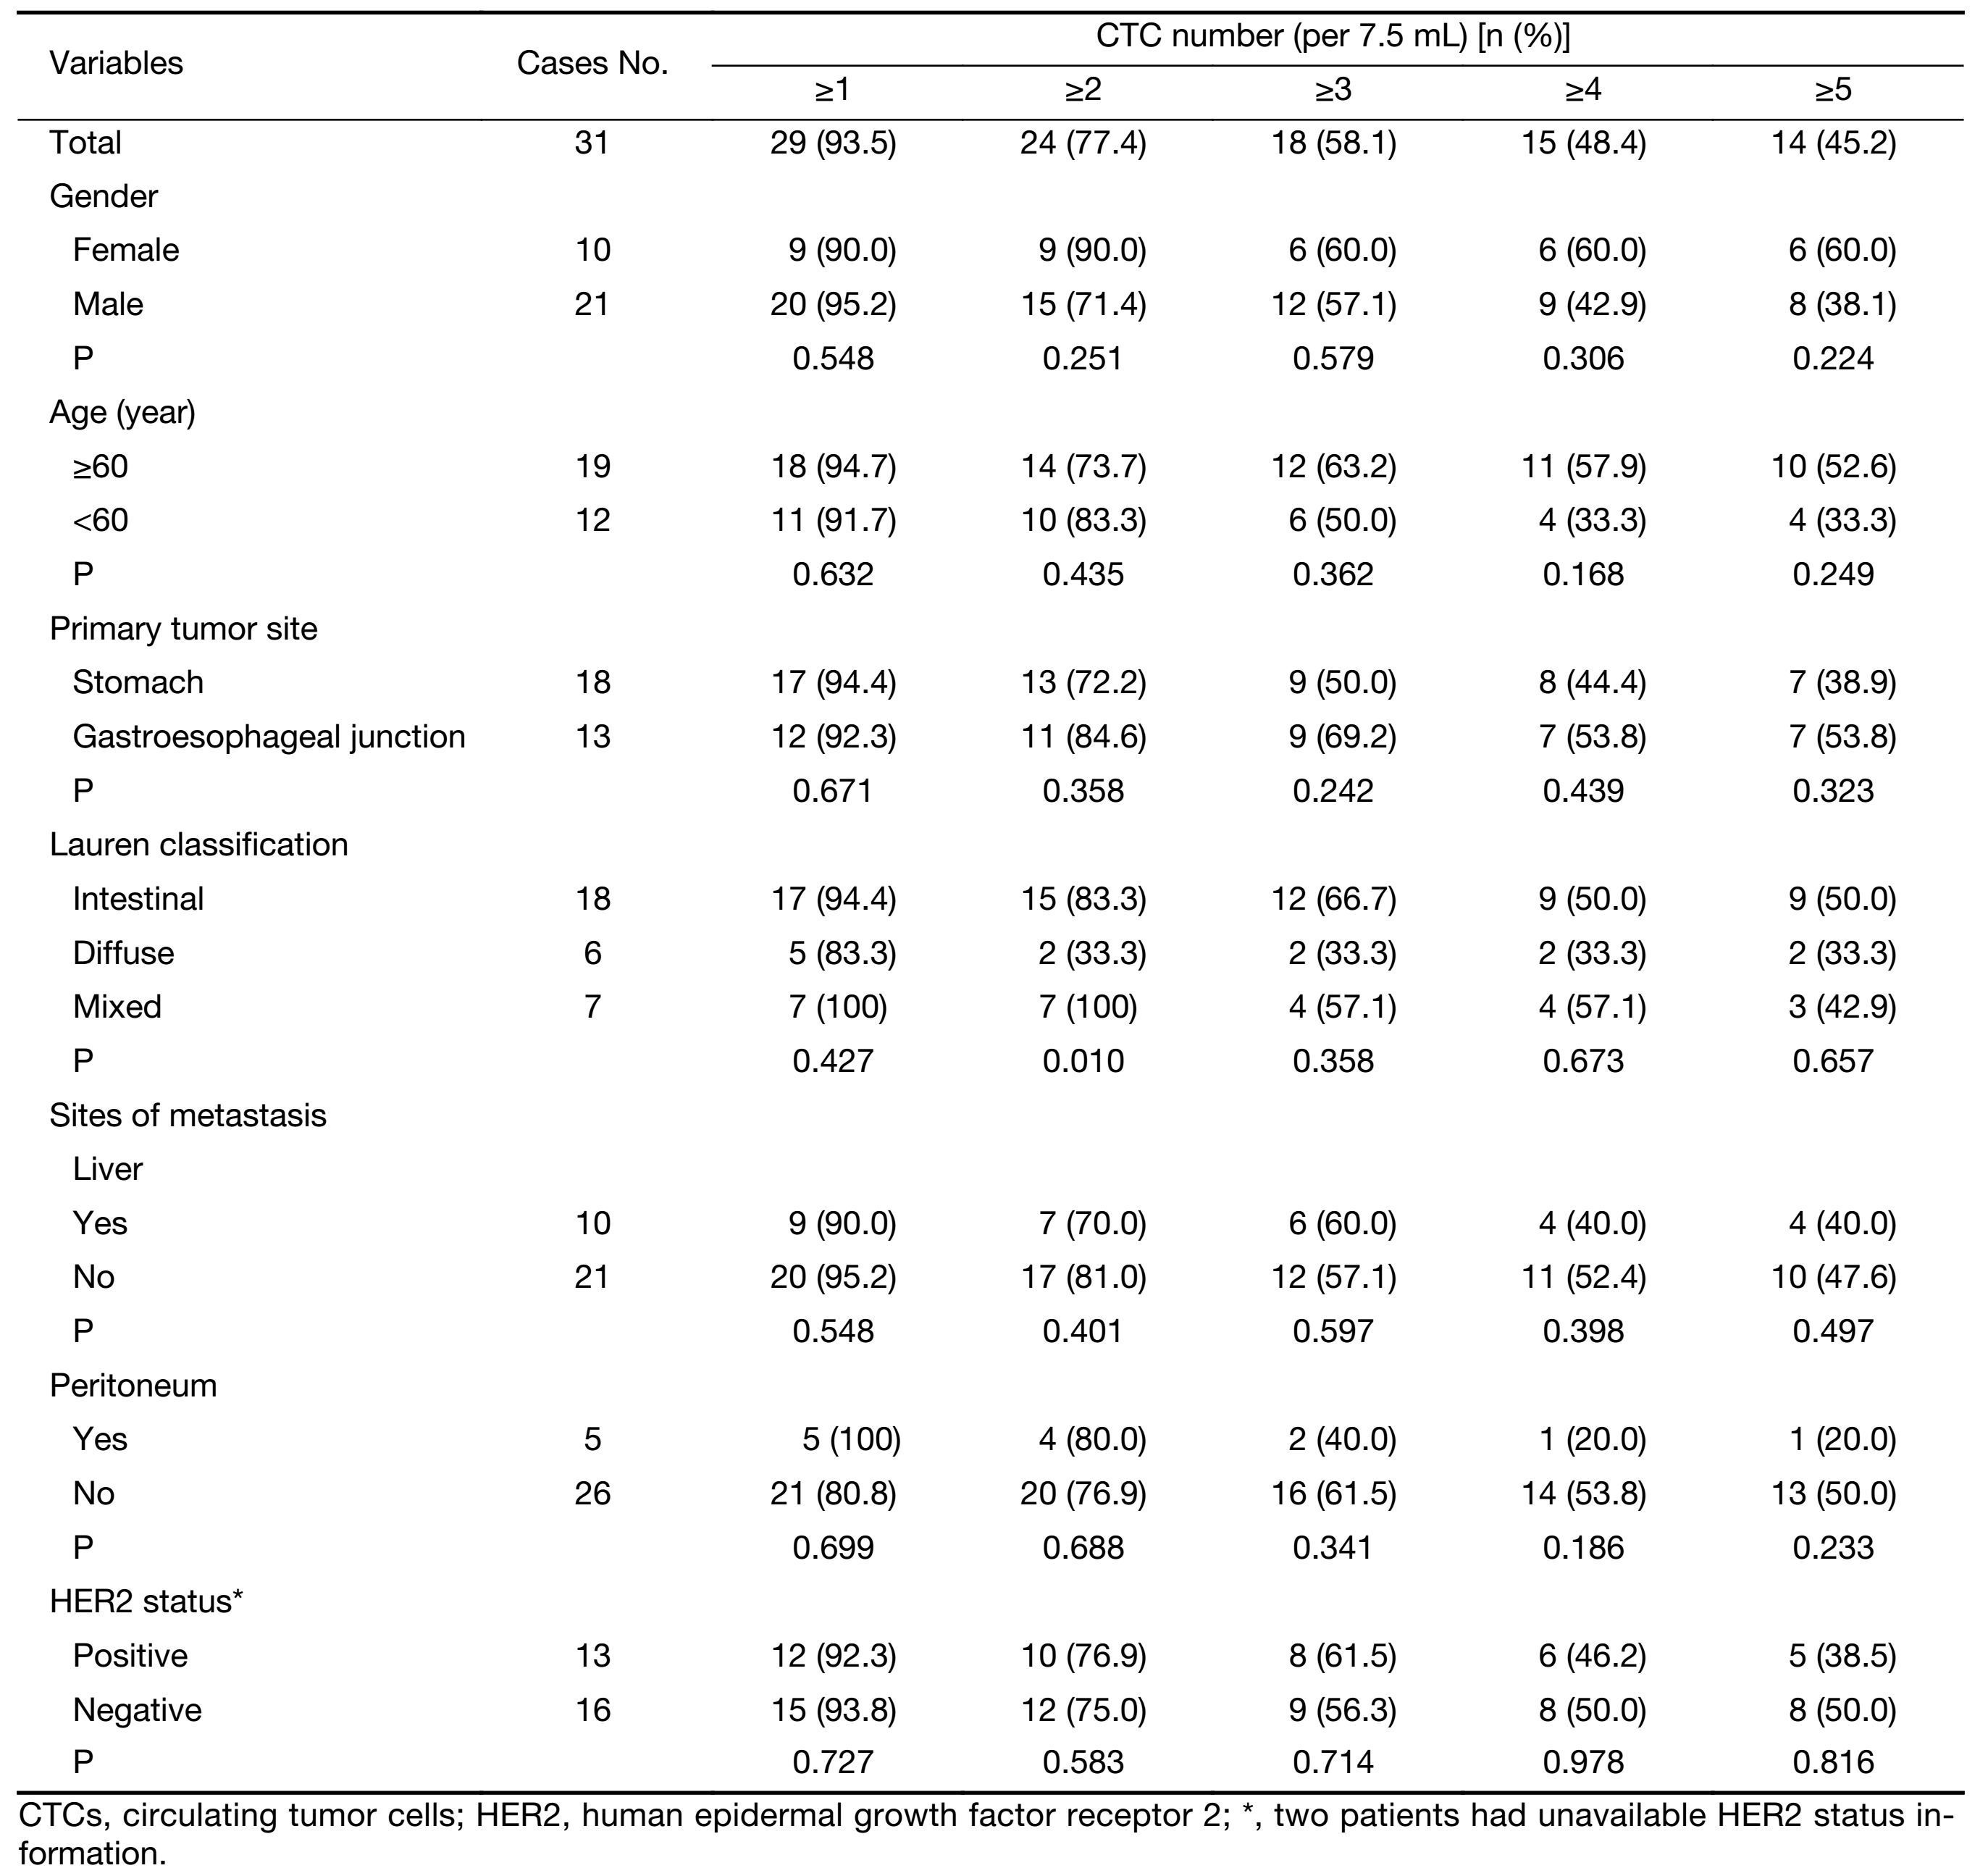
Full table
Post-therapy CTCs correlate with PFS and OS
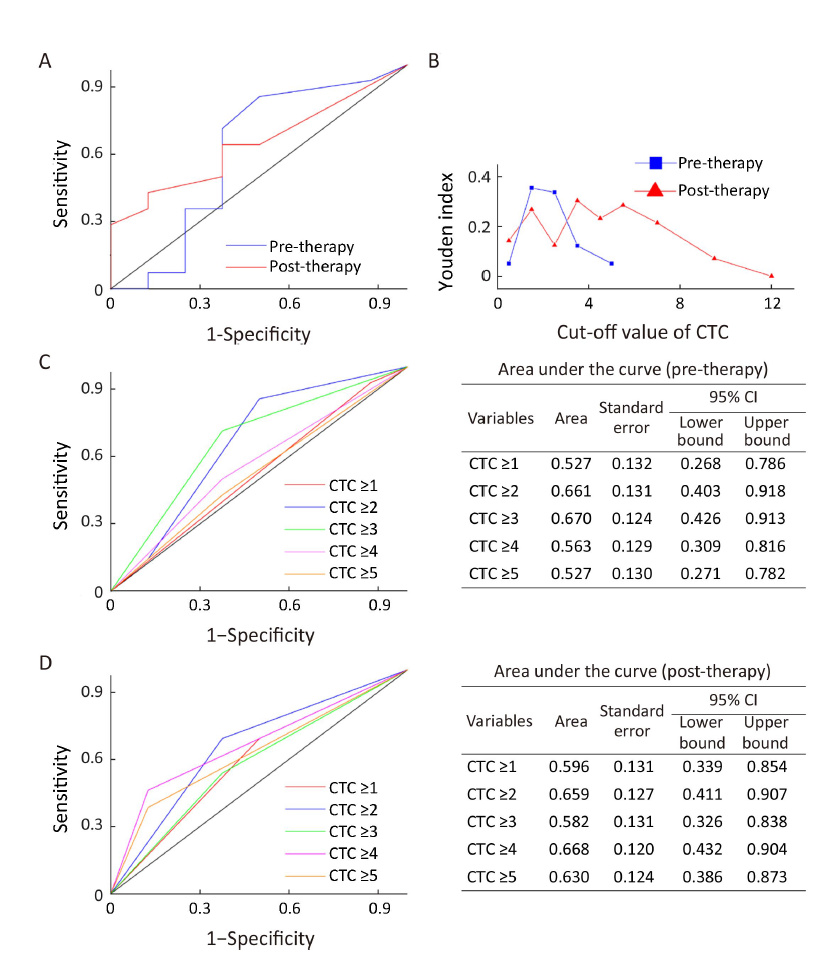
Of the 31 enrolled AGC patients, 22 had completed two cycles of therapy and a post-therapy CTC evaluation. At the time of analysis, 18 of 22 patients had PD, and 14 died. The median PFS and OS were 8.1 [95% confidence interval (95% CI), 6.7−9.4] months and 18.7 (95% CI, 12.7−24.6) months, respectively. To establish an optimal threshold of CTCs for predicting PFS and OS, ROC curves and Youden index were estimated for both pre- and post-treatment CTCs (Supplementary Figure S1) (18). We observed that <4 CTCs per 7.5 mL was a favourable threshold, whereas ≥4 was an unfavorable value in this study.
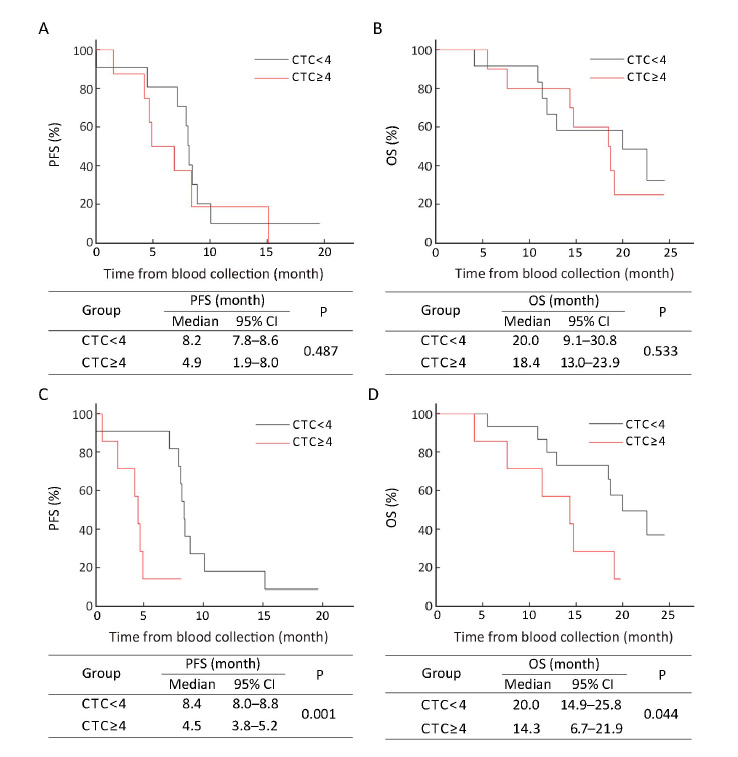
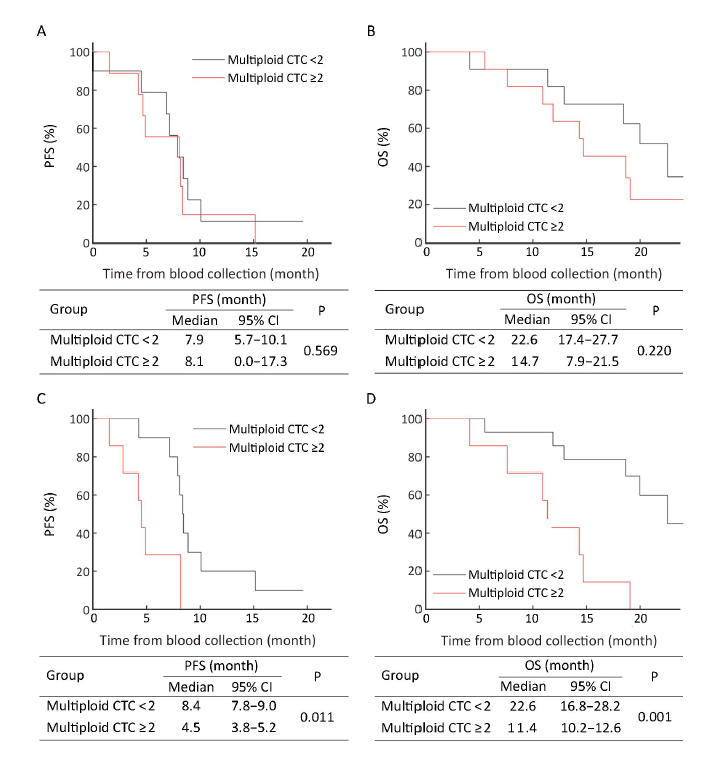
In pre-treatment patients, those with ≥4 CTCs had the median PFS and OS as shown in Figure 1A, B and these were not significantly different from patients with <4 CTCs (P=0.487, P=0.533, respectively). However, 6 weeks after therapy initiation, the median PFS of patients with ≥4 post-therapy CTCs was 4.5 (95% CI, 3.8−5.2) months, which was significantly shorter than that of patients with <4 post-therapy CTCs [8.4 (95% CI, 8.0−8.8) months, P=0.001] (Figure 1C). For median OS, similar results were obtained. The patients with ≥4 post-therapy CTCs had inferior median OS [14.3 (95% CI, 6.7−21.9) months] compared with those with <4 post-therapy CTCs [20.0 (95% CI, 14.9−25.0) months, P=0.044) (Figure 1D). Data suggest that a threshold of unfavorable post-therapy CTCs (≥4) may help predict inferior PFS and OS.
Correlation of multiploidy of chromosome 8 in CTCs with PFS and OS
Our previous work indicated that aneuploidy of chromosome 8 in CTCs correlated with therapeutic response in AGC patients. Triploid chromosome 8 CTCs were constantly chemoresistant, whereas multiploid CTCs may develop acquired resistance after chemotherapy (12). In the current study, correlation of enumeration of triploid and multiploid chromosome 8 CTCs (hereafter referred to triploid and multiploid CTCs respectively) with patient prognosis was investigated.
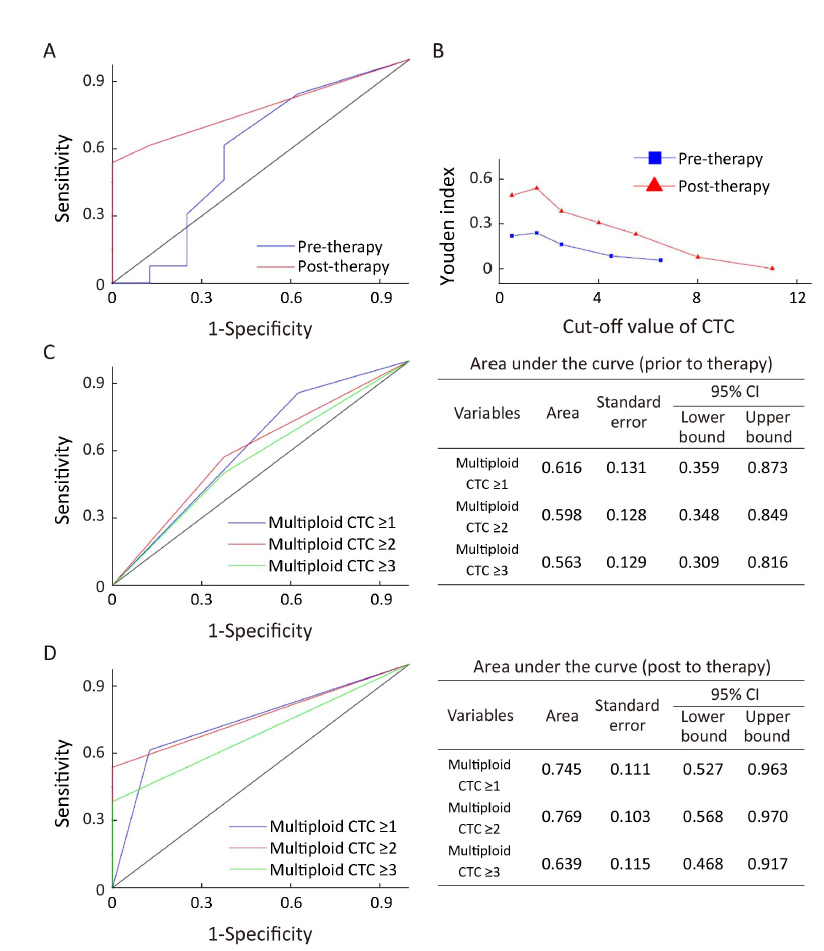
Based on estimated ROC curves and Youden index, ≥1 triploid (data not shown) and ≥2 multiploid (Supplementary Figure S2) CTCs were selected as an unfavorable threshold in this study. Although neither pre- nor post-treatment triploid CTCs were correlated with PFS and OS (data not shown), patients with ≥2 post-therapy multiploid CTCs had significantly shorter median PFS and OS compared with those with <2 post-therapy multiploid CTCs [4.5 (95% CI, 3.8−5.2) months vs. 8.4 (95% CI, 7.8−9.0) months, P=0.011; 11.4 (95% CI, 10.2−12.6) months vs. 22.6 (95% CI, 16.8−28.2) months, P=0.001]. No significant correlation of pre-treatment multiploid CTCs with PFS and OS was found (Figure 2). Six weeks after therapy, inferior PFS and OS were observed in patients with ≥2 multiploid CTCs compared with patients with <2 multiploid. Thus, unfavorable (≥2) post-therapy multiploid CTCs may predict inferior PFS and OS for AGC patients.
Variations of multiploid CTCs in response to therapy correlate with PFS and OS
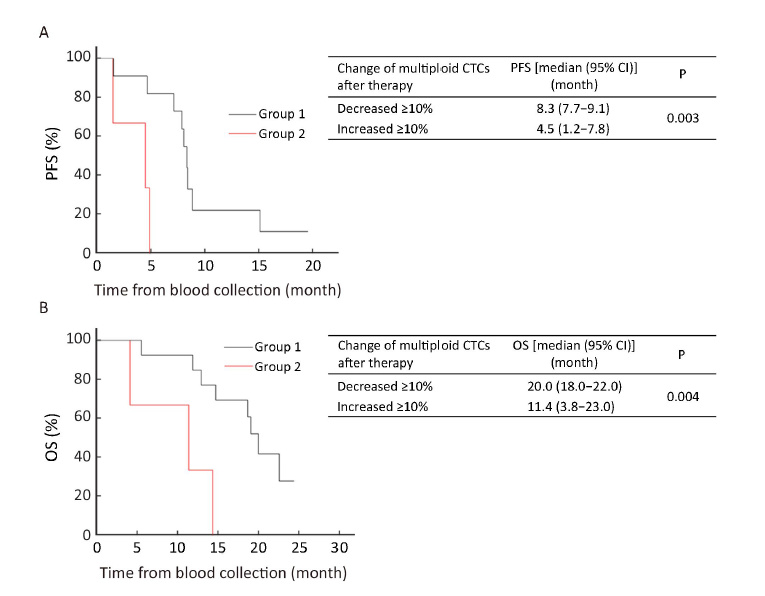
To investigate the significance of multiploid CTCs, variations of quantified multiploid CTCs before and after treatment in response to therapy were compared. Patients after 6 weeks of therapy were classified into two groups: Group 1 with the number of multiploid CTCs decreased ≥10% following therapy; and Group 2 with the number of multiploid CTCs increased ≥10%. As shown in Figure 3A, the median PFS of Group 2 was significantly shorter than that of Group 1 [4.5 (95% CI, 1.2−7.8) months vs. 8.3 (95% CI, 7.7−9.1) months, P=0.003]. Similar results were observed with respect to the median OS. Group 2 had inferior median OS compared to Group 1 [11.4 (95% CI, 3.8−23.0) months vs. 20.0 (95% CI, 18.0−22.0) months, P=0.004] (Figure 3B). Statistical analysis showed that quantitative comparison of multiploid CTCs after therapy may help evaluate therapeutic response and patient prognosis. Patients with ≥10% decreased multiploid CTCs after the first 2 cycles of therapy may have improved PFS and OS and those with ≥10% increased multiploid CTCs after the first 2 cycles of therapy may have inferior PFS and OS.
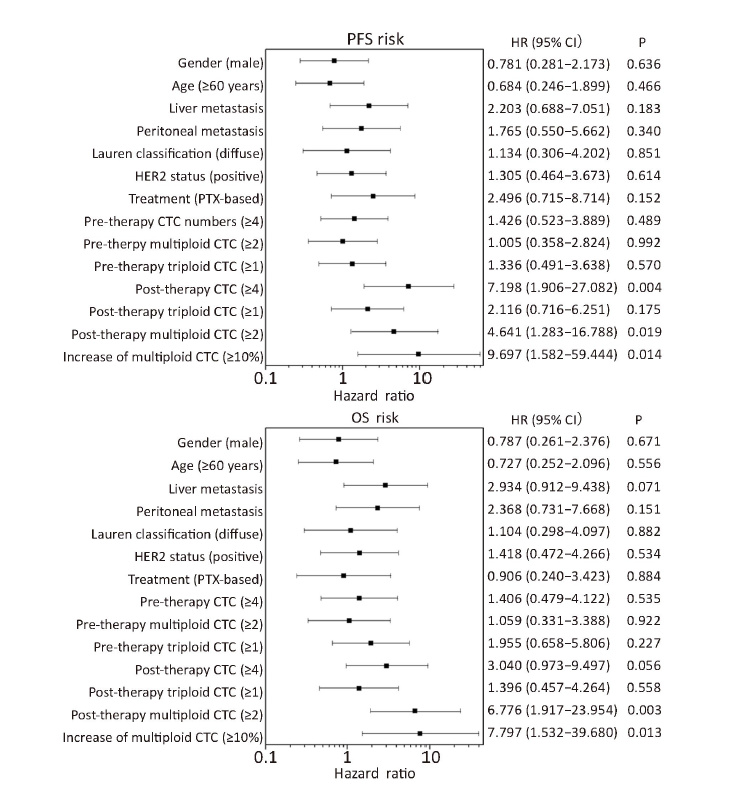
To compare the predictive value of variable multiploid CTCs with the one-site unfavorable CTCs, Cox proportional hazards regression model was used and the results showed that several unfavorable parameters were associated with inferior PFS and OS (Figure 4). A ≥10% increase of multiploid CTCs after therapy indicated the highest risk of progression and mortality. Moreover, multivariate analysis demonstrated that after adjusting for clinically significant factors (including post-therapy CTCs, post-therapy multiploid CTCs and increase of multiploid CTCs which were significant predictors in Cox univariate analysis), only ≥10% increase in multiploid CTCs was an independent predictor of PFS (HR, 9.697; 95% CI, 1.582−59.444; P=0.014) and OS (HR, 6.833; 95% CI, 1.350−34.583; P=0.020). Thus, comparing multiploid chromosome 8 CTCs before and after treatment can be used to evaluate therapeutic efficacy.
Discussion
Clinical validity of the CTCs shed from various solid tumors including AGC has been published elsewhere (1,3,4,11). Nevertheless, clinical application of a conventional epithelial cellular adhesion molecule (EpCAM)-dependent strategy for CTC measurement is limited due to heterogeneous expression of EpCAM or the absence of both EpCAM and cytokeratin (CK) induced by epithelial-mesenchymal transition (EMT) (4,19-21). Our previous work confirmed that EpCAM-independent SE-iFISH was better than an EpCAM-dependent strategy for measuring CTCs in AGC patients (12). Here, we report that most patients had ≥1 CTC per 7.5 mL as measured by SE-iFISH. Post-therapy patients with ≥4 CTCs had worse PFS and OS compared with those with <4 CTCs. So, post-therapy CTC counts may indicate the prognosis of AGC.
Triploid CTCs measured before or after treatment did not correlate with PFS and OS, perhaps due to the intrinsic chemoresistance of trisomy CTC, causing an unchanged number of triploid CTCs after therapy (12). However, unfavorable (≥2 per 7.5 mL) multiploid CTCs in post-therapy patients was significantly associated with inferior PFS and OS. Moreover, patients with ≥10% decrease in multiploid CTCs after the first 6 weeks of therapy may have improved PFS and OS, whereas those with ≥10% increase in multiploid CTCs had inferior PFS and OS.
Compared with one-site unfavorable total CTCs and the subtype of multiploid chromosome 8 CTCs, a 10% increase in post-treatment multiploid CTCs had the greatest highest HR for PFS and OS, and it was the only independent prognostic value according to Cox multivariate analysis. Although the optimal cut-off value for variation of multiploid CTCs needs to be further analyzed in expanded studies, data in this study show a correlation of multiploid CTCs with acquired drug resistance (11). Also, multiploid CTC counts in post-therapy patients might predict the course of AGC as they offer a more rapid method of evaluation compared with radiographic imaging. Karyotypic characterization of enriched CTCs during therapy might replace imaging to assess therapeutic resistance, and guide the clinical treatment of cancer patients.
Molecular mechanisms of aneuploidy of CTCs and its correlation to diverse therapeutic sensitivities warrant the study. On-going next generation sequencing (NGS) analysis of a single CTC may reveal genomic landscapes of CTC subtypes possessing distinct clinical significance (22-25), which should facilitate the elucidation of evolutionary mechanisms involved in therapy resistance.
Conclusions
Unfavorable (≥4) post-therapy CTCs may predict inferior prognosis in AGC patients. Previous work showed that triploid CTCs in AGC patients were constantly resistant to chemotherapy, and multiploid CTCs developed an acquired chemoresistance (11). The data from this study suggested that unfavorable (≥2) multiploid CTCs in post-therapy patients were significantly associated with inferior PFS and OS. Thus, CTCs may be used to assess therapeutic efficacy and predict inferior prognosis.
Acknowledgements
The SE-iFISH platform for CTCs detection was free provided and optimized by Daisy Dandan Wang and Peter Ping Lin in Cytelligen, San Diego, CA.
Funding: This work was supported by Chinese National Natural Science Foundation (No. 81301323, 81472789); Beijing Natural Science Foundation (No. 7161002); and the Capital Health Research and Development of Special (No. 2016-1-1021).
Footnote
Conflicts of Interest: The authors have no conflicts of interest to declare.
References
- Alix-Panabires C, Pantel K. Clinical applications of circulating tumor cells and circulating tumor DNA as liquid biopsy. Cancer Discov 2016;6:479–91. [PubMed] DOI:10.1158/2159-8290.CD-15-1483
- Mateo J, Gerlinger M, Rodrigues DN, et al. The promise of circulating tumor cell analysis in cancer management. Genome Biol 2014;15:448. [PubMed] DOI:10.1186/s13059-014-0448-5
- Miyamoto DT, Sequist LV, Lee RJ. Circulating tumour cells-monitoring treatment response in prostate cancer. Nat Rev Clin Oncol 2014;11:401–12. [PubMed] DOI:10.1038/nrclinonc.2014.82
- Haber DA, Velculescu VE. Blood-based analyses of cancer: circulating tumor cells and circulating tumor DNA. Cancer Discov 2014;4:650–61. [PubMed] DOI:10.1158/2159-8290.CD-13-1014
- De Mattos-Arruda L, Cortes J, Santarpia L, et al. Circulating tumour cells and cell-free DNA as tools for managing breast cancer. Nat Rev Clin Oncol 2013;10:377–89. [PubMed] DOI:10.1038/nrclinonc.2013.80
- Marx V. Tracking metastasis and tricking cancer. Nature 2013;494:133–6. [PubMed] DOI:10.1038/494131a
- Matsusaka S, Suenaga M, Mishima Y, et al. Circulating tumor cells as a surrogate marker for determining response to chemotherapy in Japanese patients with metastatic colorectal cancer. Cancer Sci 2011;102:1188–92. [PubMed] DOI:10.1111/j.1349-7006.2011.01926.x
- Li Y, Gong J, Zhang Q, et al. Dynamic monitoring of circulating tumour cells to evaluate therapeutic efficacy in advanced gastric cancer. Br J Cancer 2016;114:138–45. [PubMed] DOI:10.1038/bjc.2015.417
- Carter L, Rothwell DG, Mesquita B, et al. Molecular analysis of circulating tumor cells identifies distinct copy-number profiles in patients with chemosensitive and chemorefractory small-cell lung cancer. Nat Med 2016. [Epub ahead print]
- Cima I, Kong SL, Sengupta D, et al. Tumor-derived circulating endothelial cell clusters in colorectal cancer. Sci Transl Med 2016;8:345ra89. [PubMed] DOI:10.1126/scitranslmed.aad7369
- Cheung KJ, Ewald AJ. A collective route to metastasis: Seeding by tumor cell clusters. Science 2016;352:167–9. [PubMed] DOI:10.1126/science.aaf6546
- Li Y, Zhang X, Ge S, et al. Clinical significance of phenotyping and karyotyping of circulating tumor cells in patients with advanced gastric cancer. Oncotarget 2014;5:6594–602. [PubMed] DOI:10.18632/oncotarget
- Jiang J, Wang DD, Yang M, et al. Comprehensive characterization of chemotherapeutic efficacy on metastases in the established gastric neuroendocrine cancer patient derived xenograft model. Oncotarget 2015;6:15639–51. [PubMed] DOI:10.18632/oncotarget
- Jordan NV, Bardia A, Wittner BS, et al. HER2 expression identifies dynamic functional states within circulating breast cancer cells. Nature 2016;537:102–6. [PubMed] DOI:10.1038/nature19328
- Gao J, Lu M, Yu JW, et al. Thymidine Phosphorylase/β-tubulin III expressions predict the response in Chinese advanced gastric cancer patients receiving first-line capecitabine plus paclitaxel. BMC Cancer 2011;11:177. [PubMed] DOI:10.1186/1471-2407-11-177
- Bang YJ, Van Cutsem E, Feyereislova A, et al. Trastuzumab in combination with chemotherapy versus chemotherapy alone for treatment of HER2-positive advanced gastric or gastro-oesophageal junction cancer (ToGA): a phase 3, open-label, randomised controlled trial. Lancet 2010;376:687–97. [PubMed] DOI:10.1016/S0140-6736(10)61121-X
- Eisenhauer EA, Therasse P, Bogaerts J, et al. New response evaluation criteria in solid tumours: revised RECIST guideline (version 1.1). Eur J Cancer 2009;45:228–47. [PubMed] DOI:10.1016/j.ejca.2008.10.026
- Youden WJ. Index for rating diagnostic tests. Cancer 1950;3:32–5. [PubMed] DOI:10.1002/(ISSN)1097-0142
- Diepenbruck M, Christofori G. Epithelial-mesen-chymal transition (EMT) and metastasis: yes, no, maybe?. Curr Opin Cell Biol 2016;43:7–13. [PubMed] DOI:10.1016/j.ceb.2016.06.002
- Lowes LE, Goodale D, Xia Y, et al. Epithelial-to-mesenchymal transition leads to disease-stage differences in circulating tumor cell detection and metastasis in pre-clinical models of prostate cancer. Oncotarget 2016. [Epub ahead of print]
- Yu M, Bardia A, Wittner BS, et al. Circulating breast tumor cells exhibit dynamic changes in epithelial and mesenchymal composition. Science 2013;339:580–4. [PubMed] DOI:10.1126/science.1228522
- Auer M, Heitzer E, Ulz P, et al. Single circulating tumor cell sequencing for monitoring. Oncotarget 2013;4:812–3. [PubMed] DOI:10.18632/oncotarget
- Ni X, Zhuo M, Su Z, et al. Reproducible copy number variation patterns among single circulating tumor cells of lung cancer patients. Proc Natl Acad Sci U S A 2013;110:21083–8. [PubMed] DOI:10.1073/pnas.1320659110
- Miyamoto DT, Zheng Y, Wittner BS, et al. RNA-Seq of single prostate CTCs implicates noncanonical Wnt signaling in antiandrogen resistance. Science 2015;349:1351–6. [PubMed] DOI:10.1126/science.aab0917
- Salvianti F, Pazzagli M, Pinzani P. Single circulating tumor cell sequencing as an advanced tool in cancer management. Expert Rev Mol Diagn 2016;16:51–63. [PubMed] DOI:10.1586/14737159.2016.1116942